Quality Control: Why High-Performing Companies Lost Their Valuation Edge
GF Data analyzes the data behind above-average financial performers

Last year’s market broke the quality premium.
In 2009, GF Data began tracking what we’ve dubbed the quality premium: a comparison of average purchase price valuations between above-average financial performing (AAFP) companies and more standard financial performing (non-AAFP) companies.
The benchmark for AAFP companies requires trailing 12-month (TTM) revenue growth of at least 10% as well as a TTM EBITDA margin of at least 10%. One can argue about these benchmarks, but the relatively low targets provide for an adequate sample size in both cohorts, and the requirement that both be met provides rigidity to financial performance tracking.
This section of the report originally appeared in the 2026 M&A Business Development Professionals to Watch issue of ACG Magazine.
(Note, the quality premium only tracks buyout transactions. In a year where growth financings and leveraged recapitalizations accounted for a greater share of deals tracked, there’s likely some additional distortion to these numbers.)
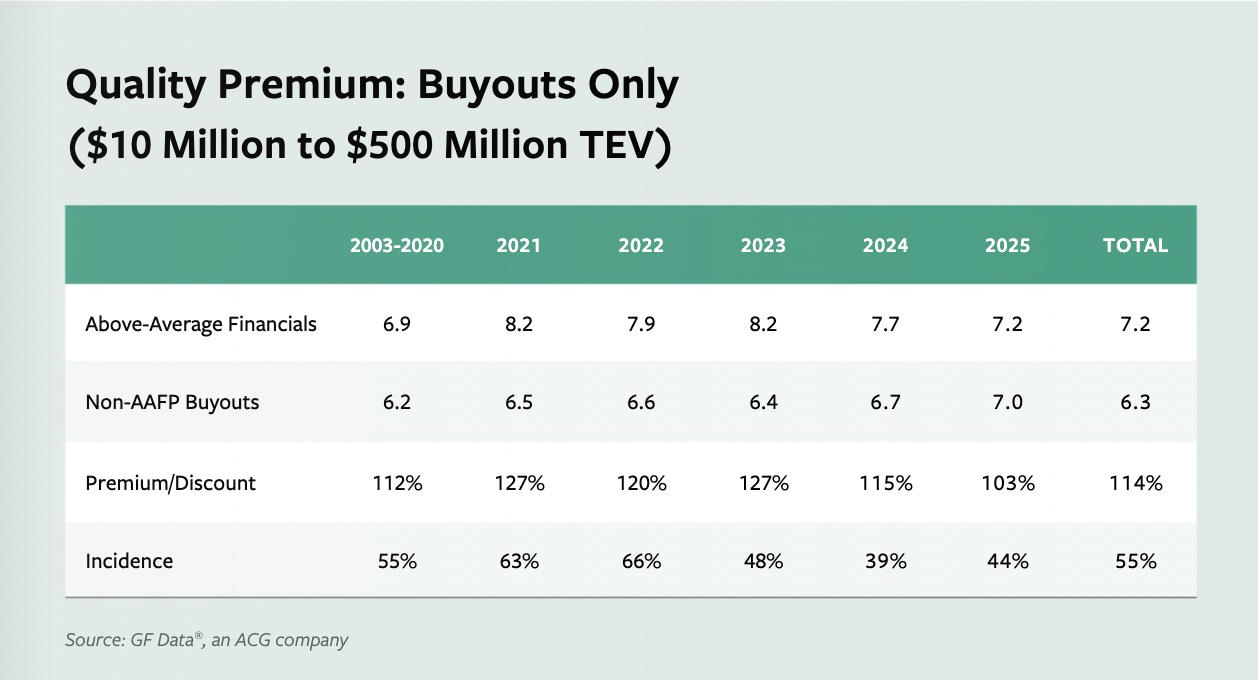
Historically, AAFP companies dominated the market, with average representation of 55% of the sample size and an average purchase price premium of 14% (7.2x TTM EBITDA for AAFP companies vs. 6.3x for non AAFP businesses).
But in 2021, things started to change (in many ways, of course, but let’s stick to the quality premium). That year, the percentage of AAFP companies that transacted surged to 63%, while the premium for AAFP companies jumped to 27%—an increase of 15 percentage points over the average from 2003–2020. TTM EBITDA multiples for AAFP companies in 2021 reached 8.2x, compared to 6.5x for non-AAFP companies.
The reasons for this were obvious.
The surge in dealmaking seen in 2021 (the highest total ever recorded by GF Data) pushed more high-quality companies into the market, and com petition among buyers forced pur chase-price multiples to historic highs for the “A” properties. “B” properties, meanwhile, were penalized in this market, notching disproportionately lower purchase-price multiples and a smaller role in the marketplace.
The following year performed similarly, with AAFP representation in the market increasing to 66% of total deals tracked by GF Data, while the premium commanded by AAFP companies fell to 20% (7.9x vs. 6.6x, respectively).
In 2023, the premium for AAFP companies crept back up to 27%, but the percentage of AAFP companies completing transactions fell to 48%—seven percentage points below the historical average—as the boom in middle-market dealmaking cooled and credit conditions began to tighten, limiting buyers’ ability to bid up the value of targets. The tightening continued in 2024, with the incidence of completed AAFP deals tracked by GF Data falling to 39% and the premium dropping to 15%, just one percentage point above the historical average.
Then, last year, the bottom fell out of the quality premium. For full year 2025, GF Data recorded just a 3% premium for AAFP companies versus non-AAFP, the lowest annual premium ever tracked. And while incidence rebounded to 44% of deals tracked, the tally still fell below the historic average of 55%.
So, what happened?
Add-ons, for one. At the mid-point of 2025, add-ons accounted for 40% of deal volume tracked by GF Data, the same total as 2024 but well above the 33% average in 2023 and 34% in 2022.
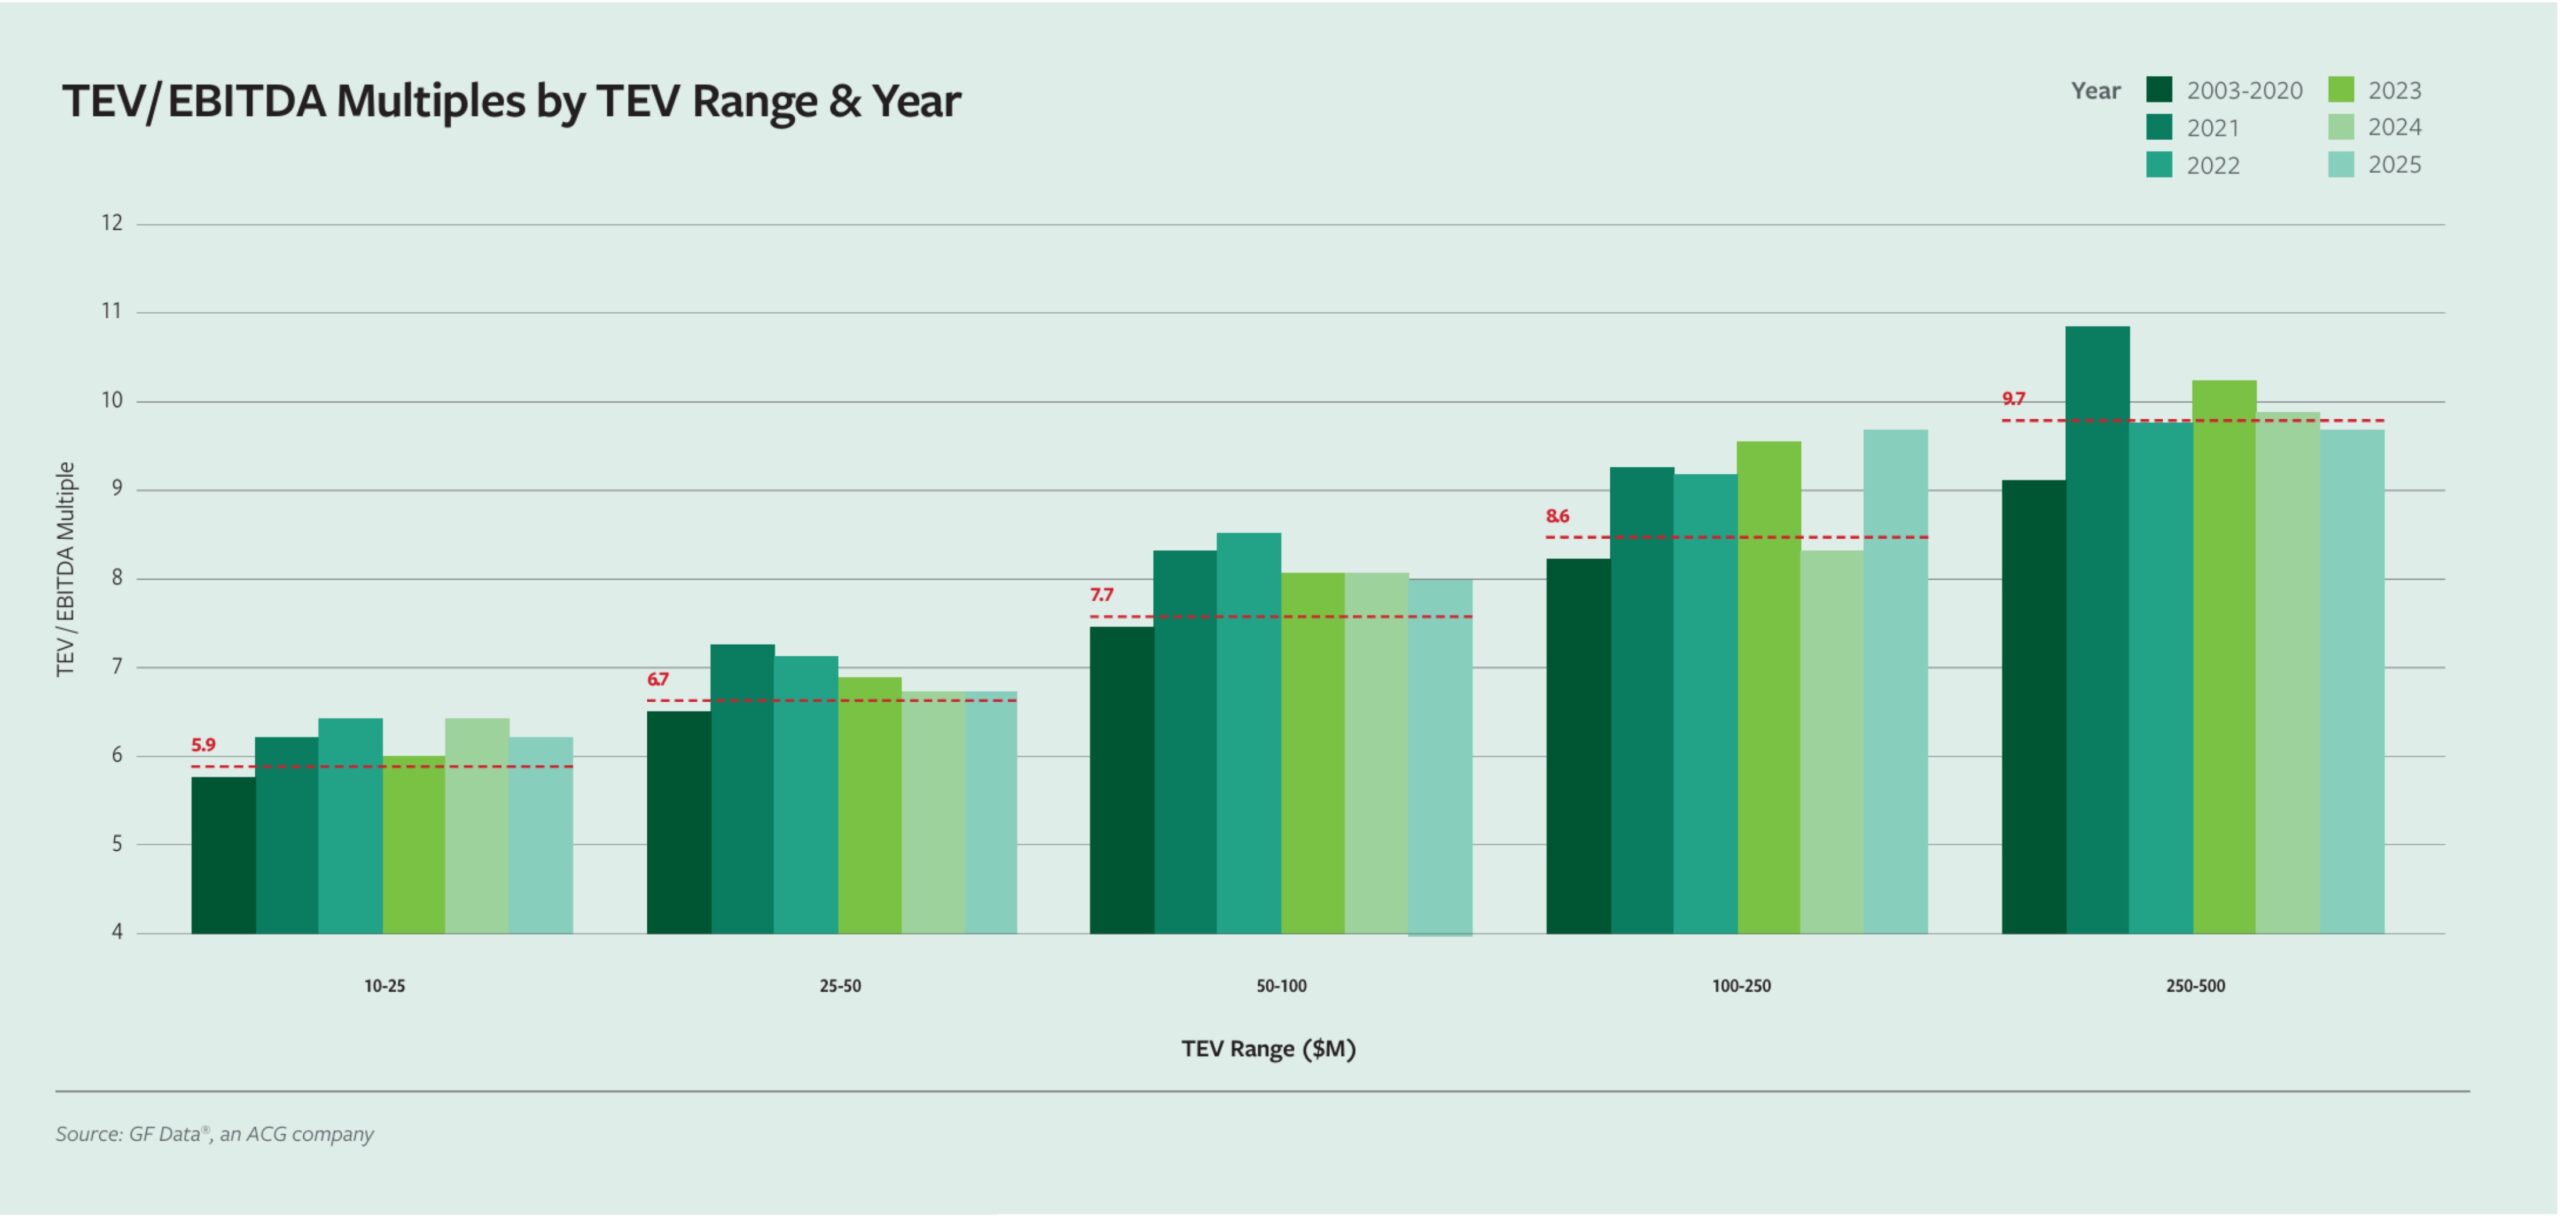
The increased add-on activity—driven in part by the need to buttress value on the average high-priced purchases in 2021 and 2022 (see chart below)—pushed up valuations for non-AAFP companies, particularly in business services.
Due to add-ons generally being smaller, the higher purchase prices amounted to less in terms of absolute costs for acquiring private equity firms. And, since many add-ons are completed with pre-existing credit facilities linked to the platform, the credit markets afforded little cap on valuations.
Deterioration in revenue growth for companies over the trailing 12-month period also played a part. The 136 completed non-AAFP deals tracked by GF Data in 2025 posted average revenue growth of just 2.1% over the prior 12 months. Meanwhile, the 104 companies in the AAFP category aver aged revenue growth of 21.9% over the same period. Interestingly, overall EBITDA margins remained strong across both cohorts.
Finally, differences in sector activity—fueled in part by the aforementioned add-on boom—also impacted the quality premium.
Let’s look at manufacturing first. Tariff-related questions and challenges had an outsized effect on both manufacturing deal flow and valuations. GF Data’s participating private equity contributors completed only half as many manufacturing deals in 2025 compared to 2024, and the quality premium reflected the challenging environment. AAFP manufacturing companies commanded an average valuation for the year of 6.9x TTM EBITDA compared to 6.3x for non-AAFP, making for a premium of 9% between the two groups.
Distribution, meanwhile, yielded a premium of 12% for the year.
Business services told a different story. While the volume of business services deals tracked by GF Data in 2025 was almost exactly the same as in 2024, the difference between AAFP and non-AAFP companies swung from premium to discount, with AAFP companies garnering an average valuation of 7.3x while non-AAFP companies averaged 7.4x. Interestingly, 42% of the companies in the non-AAFP category were add-ons, versus 38% in the AAFP grouping.
In 2026, we expect the quality premium will heal itself and revert to historical norms in the coming months.
Some signs are already there. In the fourth quarter, just 31% of deals tracked by GF Data were add-ons, slightly below the historical average and a sign that private equity seems once again more focused on buying new platforms versus buttressing existing ones. This should, in turn, limit competition for add-ons and drive down valuations. (We also saw evidence of this in Q4, when average valuations on deals in the $10 million to $25 million size cohort—the primary shopping ground for add-ons— fell to 5.7x TTM EBITDA from 6.4x in the third quarter.)
However, financial performance—specifically revenue growth—will be the ultimate arbiter on the future of the quality premium, and it’s a difficult metric to forecast given the conflicting head and tailwinds impacting the broader economy.
Bob Dunn is ACG’s Chief Product Officer.
Middle Market Growth is produced by the Association for Corporate Growth. To learn more about the organization and how to become a member, visit www.acg.org.