Public Shaming: Middle-Market Private Multiples Beat Public Sector
Despite dropping in 2022, mid-market multiples were still higher than their public market peers

Hedge fund manager Cliff Asness once noted what he called the illiquidity discount in private markets.
By Asness’ reasoning, one of the benefits of investing in private equity was to be insulated from the day-to-day gyrations of the public markets with their daily reckoning—and investors are willing to pay more for this feature. That value proposition proved true at the conclusion of 2022, as multiples on mid-market private equity transactions dropped markedly at the end of the year but were still more buoyant than public market peers.
This section of the report originally appeared in the special edition Middle Market Growth: the 2023 MAX Awards issue.
The middle market was poised for a retreat prior to the end of the year as increased macroeconomic uncertainty, a pullback in cash flow-based debt and increased borrowing charges were sure to take hold.
In the fourth quarter, the retreat materialized. Valuations on deals completed in the quarter averaged 6.8x trailing twelve months (TTM) adjusted EBITDA, down from 7.7x in the first nine months of the year, according to reporting by GF Data, an ACG company. For the full year, the 271 private equity firms that contribute data reported on 297 transactions meeting GF Data’s base parameters—total enterprise value (TEV) of $10 million-$250 million and TEV/TTM adjusted EBITDA of 3x-18x. The average purchase price multiple was 7.5x, which was a hair more than the 7.4x average recorded in 2021.
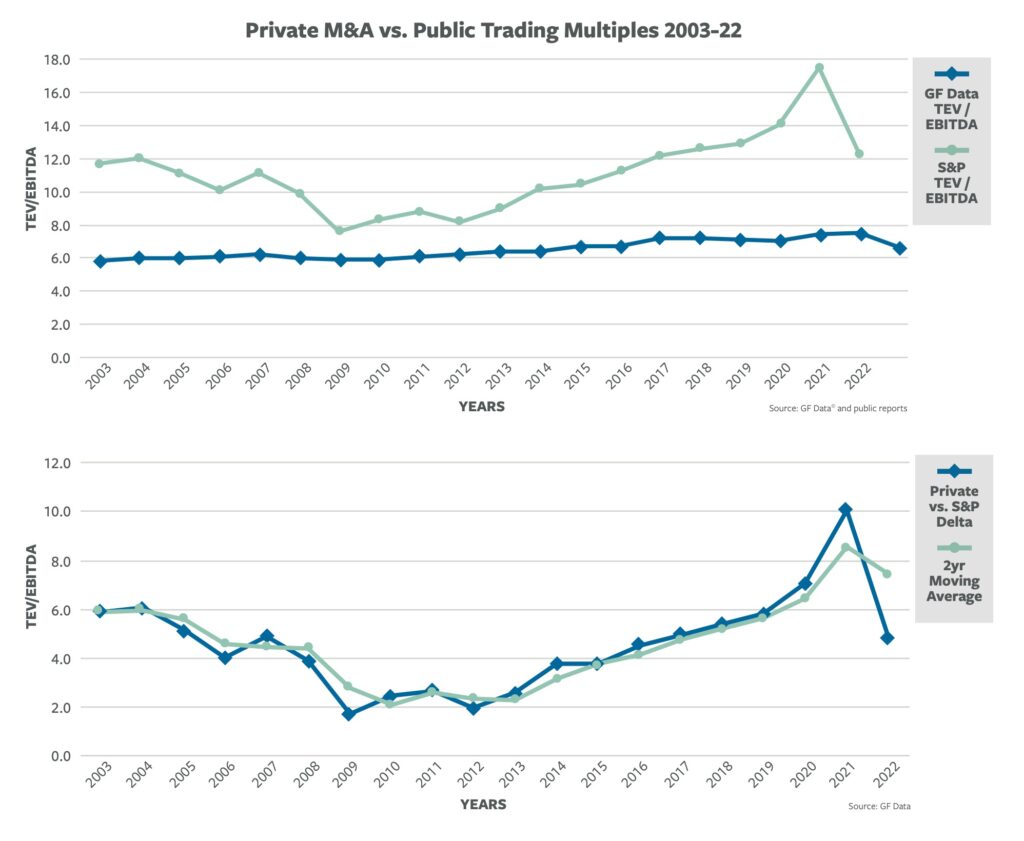
While valuations cooled at the end of the year on markedly lower deal volume in the fourth quarter, the impact still pales in comparison to the dent public market valuations experienced last year.
While valuations cooled at the end of the year on markedly lower deal volume in the fourth quarter—which we attribute to concern about corporate performance and the macro conditions referred to above—the impact still pales in comparison to the dent public market valuations experienced last year (see chart). Just 64 deals were closed by GF Data contributors in the fourth quarter compared to 172 in 4Q 2021. The S&P 500 through last September lost nearly a quarter of its value, and we recorded the narrowest spread between mid-market and public pricing since 2016.
Related content: Investors Brace for a Bumpy Ride
After reaching a 10.2x TTM EBITDA spread between the average S&P 500 company and the average purchase price of companies in GF Data’s database, the spread dropped to just 4.8x EBITDA last year—12.3x EBITDA for the S&P compared to 7.5x EBITDA for mid-market buyouts—close to the 4.6x average spread recorded over the last 20 years.
In the meantime, the standard deviation for the GF Data sample set reached 2.4 in 2022, its highest level since inception, which underscores another point we’ve made here previously: There’s a big difference between above-average companies, which will continue to trade at lofty multiples regardless of market conditions, and the average business, which will need to either hold off on selling to see if the deal cycle improves or accept lower pricing.
Over the past year, we have paid close attention to the swelling “quality premium”— our measure of the spread in multiples applied to selling businesses with above-average financials compared to the rest of the pack. (GF Data defines companies with 10% TTM EBITDA margin and at least 10% revenue growth in the prior year as above average.) The percentage of completed buyout transactions meeting our “above-average” designation jumped from the mid-50s to 54% in 2021 and 71% in the first nine months of 2022. With the conclusion of Q4, that figure declined to 68% for the whole year.
This suggests a reversal in the mindset of sellers of more and less desirable businesses. At the time that owners with better prospects were holding out, a subset of owners with less-favored businesses who’d been resisting a sale concluded that it no longer made sense to wait out the market.
Related content: A Tale of Two Markets: Lake Wobegon vs. Lake Placid
Another dynamic that kept mid-market valuations up versus public peers is structural: As debt markets have become more constrained and expensive (average initial pricing on senior debt reached 6.5% in the second half of 2022, compared to an average of 4.7% in the first half of last year), platform buyouts have become more challenging. As a result, larger firms are increasingly shopping the middle market for add-ons, which can be financed through an existing debt facility. While this no doubt dampens pricing, it also provides a backstop that public companies don’t have.
Similarly, we have heard that mezzanine firms in the fourth quarter were seeing higher quality credits and an influx of business as buyers considered financing options. This appears to have translated into a more than four percentage point increase in average use of subordinated debt on deals valued between $100 million and $250 million—to 9.6% for all of last year compared to 5.4% in 2021. Again, an advantage that middle-market buyers have that public companies do not.
Andy Greenberg is the founder of GF Data and CEO of Greenberg Variations Capital. Bob Dunn is managing director of GF Data, an ACG company.
GF Data collects and reports on platform and add-on acquisitions completed by private equity funds and other deal sponsors in the $10 million to $500 million enterprise value range.