Investors Brace for a Bumpy Ride
While market conditions are increasingly challenging, private equity firms and family offices will still compete for high-quality assets

The state of the M&A market heading into 2023 recalled the classic movie moment when Bette Davis, as aging Broadway diva Margo Channing, turns to her timorous friends and snarls, “Fasten your seat belts—it’s going to be a bumpy night!”
We’re not there yet.
GF Data’s completed deal data through the first nine months of 2022 featured valuations remaining elevated—actually edging to recent overall highs—on deal volume down markedly year-over-year.
This section of the report originally appeared in the Winter 2023 issue of Middle Market DealMaker. Read the full story in the archive.
The third quarter was also the first period in which successive Federal Reserve interest rate increases over the course of 2022 fully permeated senior pricing on M&A transactions. Initial senior pricing for the quarter averaged 6.5%, up nearly 200 basis points over the average for the prior period. Junior capital rates showed little comparable increase.
However, what was not yet reflected in the data was movement in debt availability, as distinguished from movement in cost. We share in the general anecdotal sense of retreat in cash flow-based lending since Labor Day.
It’s not surprising that increased borrowing costs did not dampen valuations as of late last year. Let’s imagine a $6 million EBITDA business selling for $48 million. Let’s say the deal is done with 3.5x senior and no sub debt. That’s $21 million. A 200 basis point increase in borrowing cost is $420,000 in year one. Adjusting for interest deductibility, that’s about $250,000. Whatever assumptions one chooses to make about principal repayment, the present value of the added cost is a low seven-figure amount. Not a big mover in our $48 million deal.
The “bumpy night” the market is girding itself for is the combination of an icing over of leveraged finance markets, continued signs of a coming recession, lingering inflation and sundry other macroeconomic worries.
Our year-end 2022 data will be released shortly. We can provide a sneak preview and say that by year-end, these market effects did translate into long-anticipated valuation retrenchment in selected industries.
For now, we can make these observations about the state of the M&A market, perhaps as participants reach for their seat belts:
-
- While deal volume is down, mid-market M&A as a market remains extraordinarily competitive. Average purchase-price multiples reached record territory through the third quarter, and deal structures migrated to agreements that allow sellers to take chips off the table but still retain some upside, such as leveraged recapitalizations and deals with significant earnouts.
-
- Amid a market with more questions than answers, we decided to analyze transactions over the last several years from funded private equity groups (PEGs) versus those led by family offices and fundless sponsors (referred to as just “family offices” going forward). We found that while the old truism of family offices paying less for deals remains true, these groups have been forced to pay more in the last seven quarters than they had previously.
-
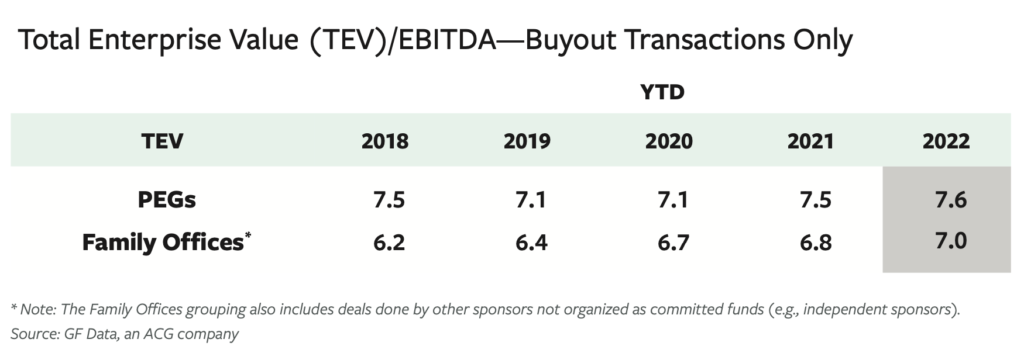
- Multiple increases for transactions sponsored by family offices have been far more muted over the last two years. When looking at buyout transactions only, the average purchase price for deals led by family offices reached 7.0x trailing 12-month (TTM) EBITDA through the third quarter of 2022, an increase in the third quarter, an increase of 0.2x over full-year 2021 and 0.3x over 2020, versus a multiple of 7.4x in the second quarter. This compares to a third quarter average of 8.2x for deals led by PEGs. Private equity deals averaged a half-turn higher for 2022 through the third quarter, coming in at 7.6x versus 7.5x for all of 2021 and a big jump from the 7.1x average of 2020.
-
- Family offices are putting in less equity on average in their transactions than their peer private equity groups. For the first three quarters of 2022, equity commitments by family offices average 45.8% for all deals and 52.4% when just platform deals are considered. This compares to an average of 51.8% and 58.6%, respectively, for PEG-backed deals.
-
- Family offices are also less likely to include rollover equity in platform buyouts they sponsor than PEGs. These groups employed seller rollover equity in 46.2% of deals tracked through the third quarter of 2022 on average to just over a turn of EBITDA. Meanwhile, private equity groups employed rollover equity in nearly 65% of transactions, and it amounted to 0.4x EBITDA more on average.
-
- And finally, family offices on average employed more debt on their transactions in 2022 through Q3 compared to private equity firms investing out of a fund. Total debt on platform transactions sponsored by family offices in the first nine months averaged 3.6x EBITDA compared to an average of 3.4x EBITDA for transactions sponsored by PEGs.
The one area where we see little difference between family offices and private equity groups is a predilection for high-performing companies with above-average financials, which we discussed in some detail in our last commentary for Middle Market Growth. (As a refresher, we make these designations based on trailing 12-month EBITDA margins and revenue growth, with some editorial judgment based on other company characteristics.)
Through the third quarter, above-average companies accounted for a record 75% of buyout transactions completed by private equity groups and displayed a pricing premium of 12% (the narrowest since we began tracking dates, through Q3).
While the totals aren’t quite as ex treme with family offices (64% and 19%, respectively), it does indicate that both sets of investors are increasingly pursuing the same exceptional opportunities.
Andy Greenberg is founder and Bob Dunn is managing director of GF Data, an ACG company and the leading provider of information on private transactions in the $10 million to $500 million value range. Greenberg is also CEO of Greenberg Variations Capital, a mergers and acquisitions advisory firm devoted to one-off or targeted transactions.
GF Data collects and reports on platform and add-on acquisitions completed by private equity funds and other deal sponsors in the $10 million to $250 million enterprise value range. Over the course of 2022, we extended the range to $500 million.