A Tale of Two Markets: Lake Wobegon vs. Lake Placid
Exploring the two worlds that emerge from GF Data's latest report

GF Data’s just-released second quarter report returns us to a well-developed truism—that the M&A market is a bifurcated one, with more and less favored businesses receiving markedly different valuations, debt support and levels of buyer interest.
In the context of an unprecedented global health crisis and ongoing macroeconomic complexity, this observation seems truer than ever—so true that it occurred to us that it might be interesting to look at the data as describing not one world, but two.
This section of the report originally appeared in Middle Market DealMaker’s Fall 2022 issue. Read the full story in the archive.
A regular feature of our reports is a delineation between above-average financial performers and other businesses being acquired by financial sponsors. We make these designations based on trailing 12-month EBITDA margins and revenue growth, with some editorial judgment based on other company characteristics. (As a refresher, GF Data collects and reports on platform and add-on acquisitions completed by private equity funds and other deal sponsors in the $10 million to $250 million enterprise value range. Over the course of this year, we’re extending the range to $500 million.)
Of the two worlds we’re seeing, one comprises businesses with above-average financial characteristics, generally reflecting more attractive industry niches and growth prospects. We’ll call that “Wobegon”—in honor of the exceptional stock of Lake Wobegon residents in “A Prairie Home Companion.”
The other world includes companies with lesser margins and growth rates, prone to more restrained valuations. But—especially in frothy markets—miracles can happen. Let’s go with “Placid” for that group, a nod to the 1980 U.S. Olympic hockey team.
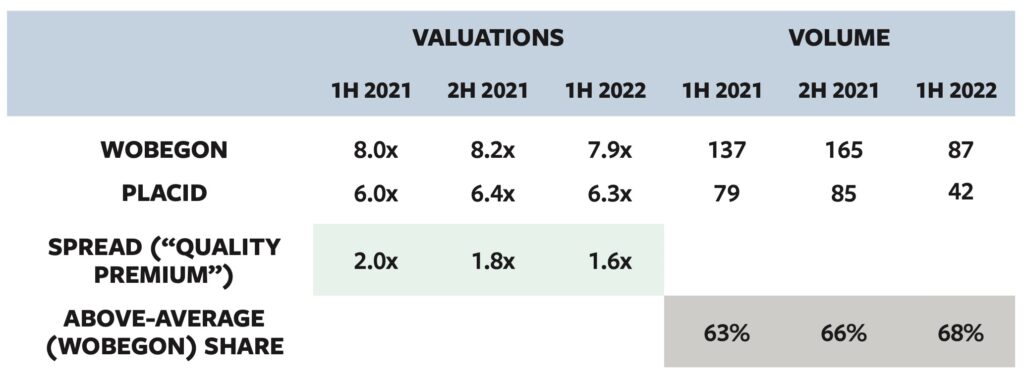
Looking at three six-month periods going back to the beginning of 2021, the chart above shows a high-level picture drawing on data from our quarterly reports and reveals some interesting insights about the two worlds.
In both Wobegon and Placid, valuations and volume edged up in the second half of 2021, driven by the torrent of completed deal activity as the market found its post-pandemic footing.
The incidence of “above-average” deals also crept up over this 18-month period. The 63% figure for 1H 2021 was itself a historic high. The customary figure going back to 2003 is in the 57%-58% range. At the same time, the quality premium—the spread between valuations in Wobegon and Placid—ticked down from two turns to 1.6x.
We believe both numbers reflect the most vexing variable in charting deal trends over time: the deals that don’t get done. As the market normalized, more attractive businesses sold easily. Companies facing difficulties accelerated or magnified by the pandemic faced a more difficult choice: Trade at the current market-clearing price or remain on the sidelines and hope for a better day. A certain number chose—or are still choosing—not to transact. Their absence from the completed deal data drives up Wobegon’s share of volume and holds aloft average multiples in Placid.
Diving Deeper
Isolating and taking a deeper dive into the two worlds affords some other observations: Valuation multiples for the first half of 2021 point to substantial activity in Placid involving companies trading from positions of weakness rather than strength. In the $100 million to $250 million deal size bracket, the average multiple for that period was 6.0x. This is not a typo. Companies that believed a rebound was coming and could afford to wait did. While year-to-date completed deal volume is clearly down, it is not down equally. As one would expect given the above analysis, the drop is steeper among the lesser performers. In Placid, completed deal volume in 1H 2022 was 53% of activity in the year-ago period. In Wobegon, it was 64%.
Of the business categories most populous in our data set, two—manufacturing and business services—followed the valuation trajectory described above in both environments. Multiples peaked in 2Q 2021, and then held their ground in 1Q 2022. Healthcare services showed continued strength in valuation in the year to date.
Related content: To Drive Value in a Down Market, Get Back to Basics
Distribution presents a different picture. Valuations fell in Placid by about a turn, from 6.5x-6.6x in 2021 to 5.5x in 2022 YTD. In Wobegon, average pricing for distribution deals was 7.4x in the first half of this year, about in line with the average last year. The roster of most active NAICS groups in 1H ’22 included two prominent distributor classes, NAICS 4234 (commercial equipment and supplies) and 4238 (machinery, equipment and supplies). Buyers are clearly rewarding distributors that have proved their resilience the past 30 months.
Manufacturing appears to be the category most hobbled by inflation, supply chain issues and distortion in year-over-year financial results. The 1H 2021 most-active list featured four manufacturing groupings; in 1H 2022, only one manufacturing grouping—3114 (preserving/specialty foods)—achieved the same volume threshold.
Who moved from one world to the other? The broader NAICS 811 category (repair and maintenance) was on Placid’s most-active list in the first half of 2021 but appears on Wobegon’s list for the year to date. This may be an early example of movement to sectors more defensive in nature.
Debt utilization continues to drive and parallel asset values. We certainly hear anecdotal reports about lenders pulling back on debt levels—but see little impact from this in the second quarter numbers. Total debt multiples have remained virtually unchanged year over year.
Related content: Manufacturers’ M&A Outlook Perseveres Through Headwinds
In 2022 so far, there is virtually no difference in total debt load on deals financed with a unitranche product—the average is in the low 4x for both cohorts. However, in deals financed with senior debt only (no sub debt) the average in Placid is 3.2x compared to 4.1x in Wobegon.
As the extended seller’s market soldiered on in 2018-19, bank lenders became competitive on a selective basis with the non-bank lenders that had by then come to dominate the private leverage finance market. After the profound disruption of 2020-21, game pieces returned to the board in more or less the same places. If the debt market becomes more selective, though, we would not be surprised if stand-alone senior financing for good but not great businesses is one of the first pieces to come off.
Andy Greenberg is founder and Bob Dunn is managing director of GF Data, an ACG company and the leading provider of information on private transactions in the $10 million to $500 million value range. Greenberg is also CEO of Greenberg Variations Capital, a mergers and acquisitions advisory firm devoted to one-off or targeted transactions. For more information, visit gfdata.com or greenbergvariations.com.