The Big Picture: Visualizing the 2023 Global M&A Dealscape
Examine the 2023 M&A data from S&P Global Market Intelligence

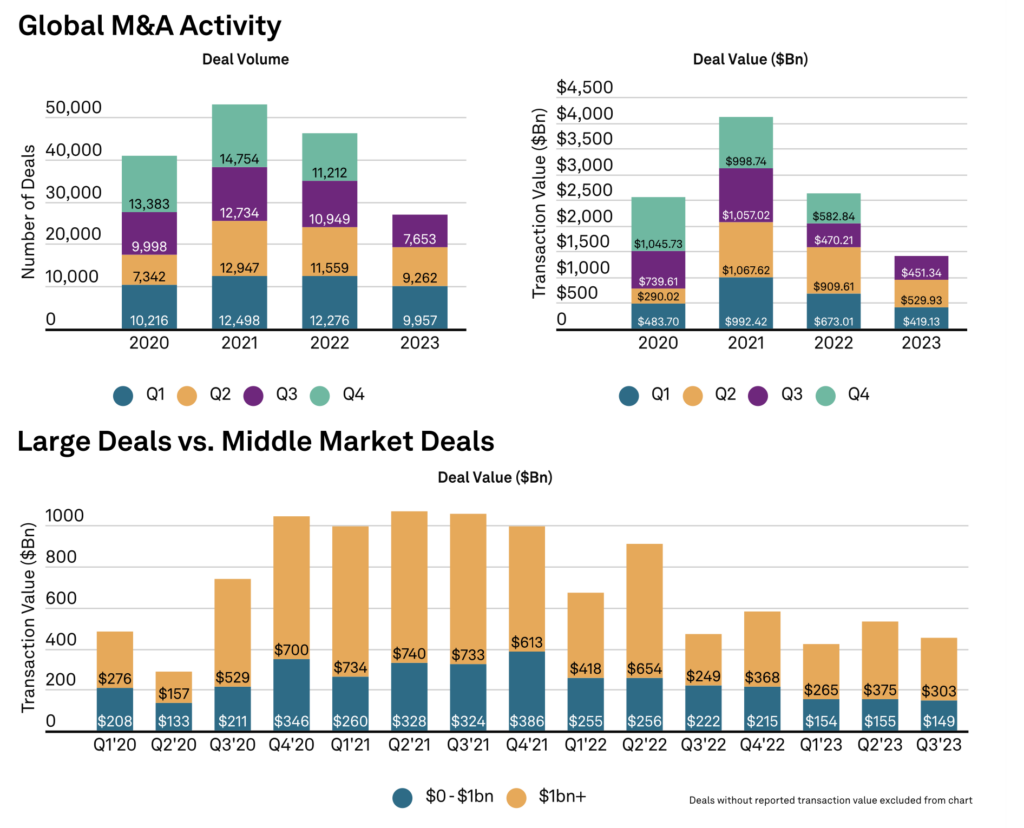
Third quarter global M&A activity continued its decline from the highs seen in 2021.
The total year-to-date deal value was at its lowest level since 2020, just over $1 trillion. Market participants still contended with macro issues including inflation, higher financing costs, increased regulatory scrutiny and ongoing armed conflict.
While overall deal values declined 15% quarter-over-quarter, the less volatile middle market only experienced a 4% decline.
This section of the report is sponsored by S&P Global Market Intelligence and originally appeared in the special edition Middle Market Growth 2024 Multiples Report. Read the full issue in the archive.
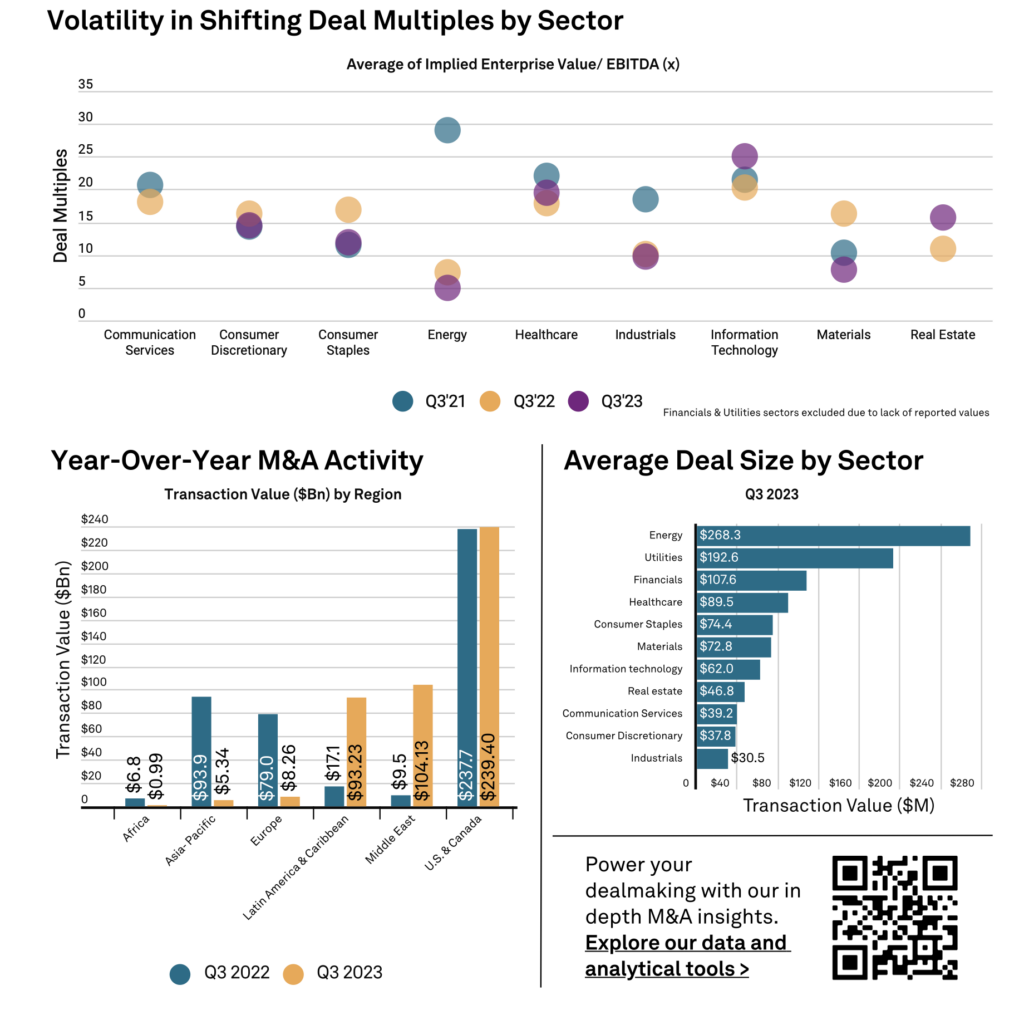
Mega deals did see a resurgence, but large deal activity still declined 20% from Q2 2023. As for sector activity, Energy led the way with an average deal size of $268 million in Q3 2023.
Note: Data as of Oct. 5, 2023. Includes announced or completed deals between 1/1/2020 and 9/30/2023, where the buyer acquired a majority stake in a company or asset with the target’s geographic location and primary industry disclosed. Source: S&P Global Market Intelligence.
Middle Market Growth is produced by the Association for Corporate Growth. To learn more about the organization and how to become a member, visit www.acg.org.