The Regional Map of Middle-Market M&A
A look at what’s driving differences in deal pricing across the U.S.

Middle-market M&A pricing does not look the same in every part of the country, but the regional spread is narrower and more compositional than a casual reading of the numbers suggests.
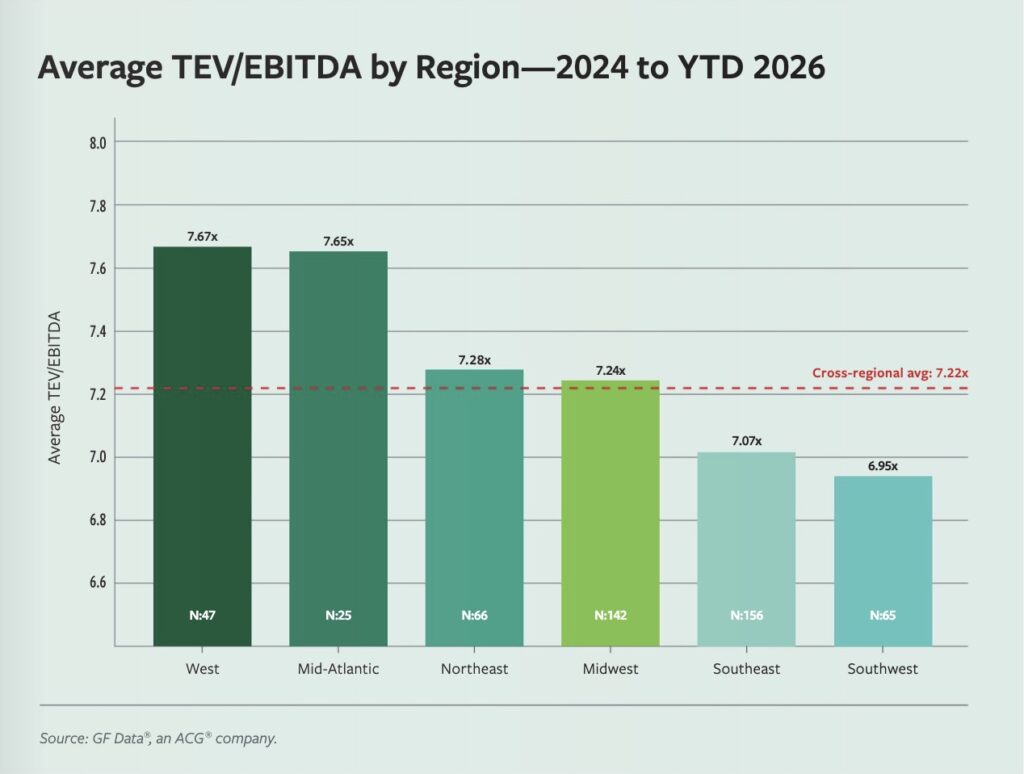
Across the 506 U.S. transactions in the GF Data sample closed since the start of 2024, average total enterprise value (TEV)/trailing 12-month (TTM) adjusted EBITDA multiples by region span roughly 0.7x from the highest-priced region to the lowest. That gap is meaningful, but most of it dissolves once industry mix and deal size are accounted for.
This section of the report originally appeared in the Fall 2026 Events Preview issue of ACG Magazine.
The more durable regional differences sit not in headline pricing but in how transactions are structured, where one region stands apart from the rest in a way that few practitioners are likely watching for.
A note on the data: GF Data began consistently tracking acquired company location in the third quarter of 2024. The regional figures to the right reflect over 500 U.S. trans actions closed since then, drawn from GF Data’s standard universe of transactions with $10 million to $500 million TEV and valuation multiples of 3x to 18x TEV/ EBITDA. The Mountain-Plains region is excluded due to its limited sample size.
Average valuation by region clusters in a tighter band than the cross-regional spread might suggest. The West region prints the highest reading at 7.67x EBITDA, with the Mid-Atlantic close behind at 7.65x based on a smaller sample of 25 transactions. The Northeast and Midwest sit in a narrow range at 7.28x and 7.24x respectively, while the Southeast, which carries the largest single share of regional deals at 156 transactions, lands at 7.07x. The Southwest registers the lowest regional average at 6.95x, a roughly 0.7x discount to the West reading and 0.3x below the cross-regional average.
The absolute spread is real but modest, with the 0.7x range narrower than the gap between many adjacent TEV size tiers, where size effects alone routinely produce wider differentials. The rank order also defies common intuition; the Northeast, despite housing the largest concentration of sponsor capital, prints below the West and Mid-Atlantic averages, while the Southwest, which contains the gravitational center of Texas-based private equity, lands at the bottom of the U.S. distribution.
The temptation when reading regional data is to assign causality to geography itself, as if something about doing business in one region inherently commands a premium relative to another. The data does not bear that reading; the regional spread largely reflects the types of deals happening in each market, not geography alone.
The Composition Effect
U.S. regions carry meaningfully different sector mixes, and those differences track the valuation spread more closely than geography itself. The Midwest is the most manufacturing-weighted region, where branded consumer, unbranded consumer, and B2B manufacturing together account for 39% of trans actions. The Southeast is the most services-heavy, with 44% of its transactions concentrated in business services, while the Southwest combines a similarly high services share (43%) with substantial manufacturing concentration (32%) and the only meaningful oil and gas services exposure in the regional sample. The Mid-Atlantic carries the most balanced sector mix and the greatest combined share of higher-multiple sectors, including healthcare, technology, and distribution.
Because middle-market valuations vary materially by sector, with business services and technology trading at sustained premiums to manufacturing in the broader GF Data universe, these compositional differences flow directly through to the apparent regional pricing differences. The Midwest’s near-flat valuation reading—despite a large sample— reflects its heavy manufacturing weighting, while the West region’s premium tracks its lighter consumer manufacturing exposure and heavier concentration in business services, the highest-priced major sector in the regional sample after healthcare.
The tension shows up most sharply in business services, which has been one of the most active and highest-priced segments in the GF Data universe over the past two years, averaging 7.4x EBITDA on 283 transactions since the start of 2024 and accounting for the largest single share of recent middle-market deal flow. Yet the two regions most concentrated in business services, the Southeast at 44% and the Southwest at 43%, sit at the bottom of the regional valuation distribution rather than the top, inverting what intuition would predict.
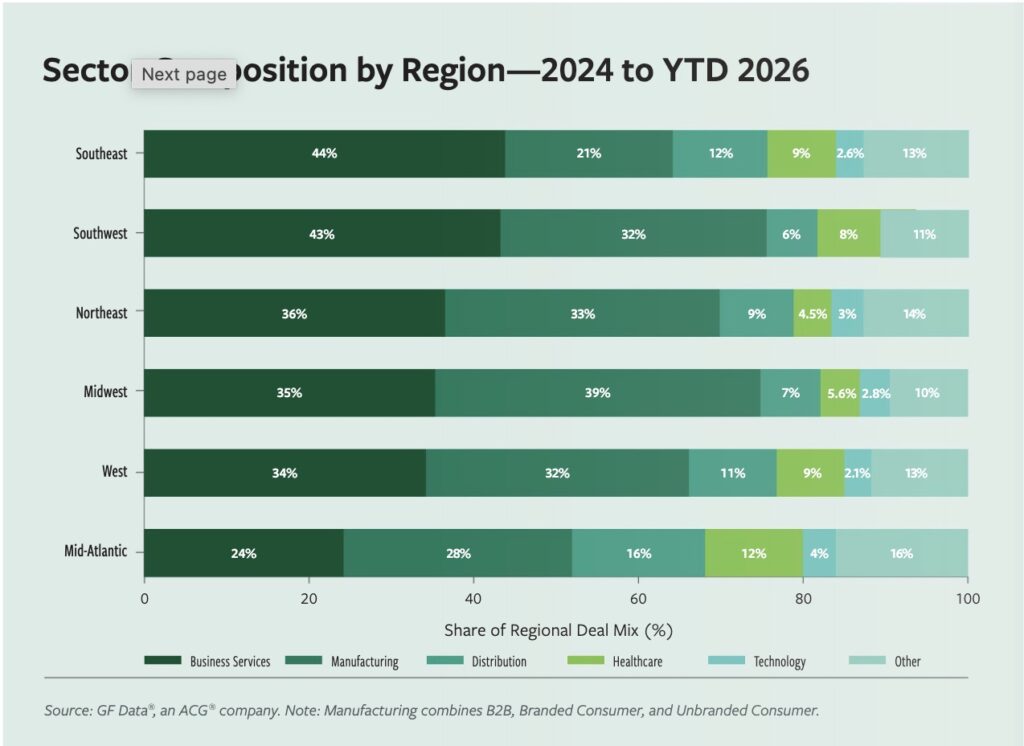
The mechanism that breaks the intuition is deal size, with business services transactions in those regions clustering heavily in the $10 million to $25 million TEV tier, where smaller average sizes price below the cross tier average, regardless of sector. The regional reading aggregates both effects, and in the Southeast and Southwest, the size effect wins.
The Southwest Anomaly
If sector mix and deal size account for most of the regional pricing variation, the data still leaves one feature of the regional picture that does not resolve cleanly: how aggressively sellers participate in their own transactions across regions.
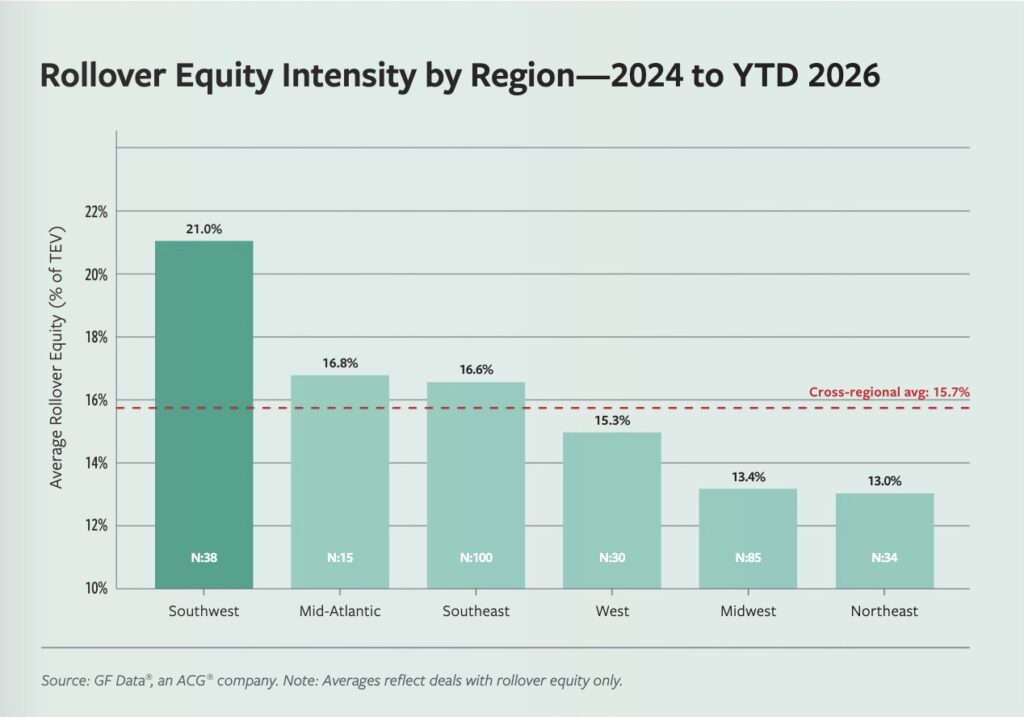
Rollover equity, the portion of total enterprise value that selling owners retain and reinvest along side the buyer, averages between roughly 13% and 17% across most U.S. regions in the GF Data sample, but the Southwest stands clearly apart. Among Southwest transactions with rollover equity, the average rollover share sits at 21% of TEV, more than 4 percentage points above the next-highest major region and 8 points above the Northeast and Midwest. The incidence rate of roll over participation in the Southwest, at roughly 59% of deals, is broadly in line with the cross-regional norm; the difference shows up in the size of rollovers, not the frequency.
Neither sector mix nor seller-type composition fully explains the pattern. The Southwest’s industry composition would, on a national basis, predict rollover percentages closer to the middle of the regional range than the top. Seller-type composition would predict the same; the Southeast, not the Southwest, leads the regional sample in transactions involving individual or family sellers at 87% of regional deals, yet the Southeast prints a rollover average more than 4 points below the Southwest. The pattern persists even within seller type—among transactions involving individual or family sellers, Southwest deals roll an average of 21.3% of TEV against a range between 13.5% and 17.3% in the other regions.
A plausible explanation lies outside the structural cuts the data captures: a Texas-anchored sponsor community that has historically favored deeper seller alignment, the regional valuation discount that gives sponsors room to negotiate larger continuing positions as a bridge to closing, and a deal-construction culture that simply favors heavier seller participation than national norms. The data confirms the anomaly is real; explaining it requires reaching beyond what the dataset measures.
For practitioners advising on opportunities in the Southwest, the practical takeaway is that the region’s discount in headline pricing comes packaged with materially heavier seller participation in the post-close capital structure; the headline multiple alone is an incomplete picture of how value transfers in transactions within the region.
The regional cut of middle-market M&A is most useful as a diagnostic rather than a benchmark. The 0.7x spread between the highest- and lowest-priced regions looks geographic at first glance but largely resolves into sector mix and deal size effects on closer inspection. Where the regional data genuinely tells a distinctive story is in how deals are constructed rather than how they are priced. The Southwest’s elevated rollover intensity is the clearest example, carrying practical implications for any sponsor or advisor evaluating opportunities in the region.
The broader lesson for practitioners is to treat regional cuts as a starting point for follow-up questions about composition and structure, not as a standalone read on pricing risk. The map of middle-market M&A does not draw cleanly along state lines.
Ryan McCann is GF Data‘s Senior Middle-Market Analyst.
ACG Insights is produced by the Association for Corporate Growth. To learn more about the organization and how to become a member, visit www.acg.org.