Costly Capital: Changing Dynamics in the Debt Market
GF Data’s findings reveal a growing dichotomy across deals and the impact of changing dynamics in the debt market

The stage was set coming out of 2022 for disruptions in middle-market private equity financing, and the first quarter delivered.
After a modest rise in the cost of capital at the end of 2022, average pricing on senior debt tracked by ACG’s GF Data shot to 8.1%—a marked jump from the 6.9% average recorded in the fourth quarter. That’s also the highest interest rate on senior debt GF Data has seen since early 2007.
Meanwhile, a 1% increase in average fees on subordinated debt and smaller increases in average coupon and payment-in-kind notes pushed all-in pricing to 16.8%, up 2% from the average for all of 2022.
Despite this, GF Data recorded an average purchase-price multiple across all transactions of 8.1x trailing 12 months (TTM) EBITDA for all reported deals with total enterprise values between $10 million and $500 million. That was well above the 6.9x average recorded in the fourth quarter of 2022 and close to that year’s third quarter average.
It was really a tale of two markets and, depending on where you looked, it was the best of times or the worst of times.
But it was really a tale of two markets and, depending on where you looked, it was the best of times or the worst of times.
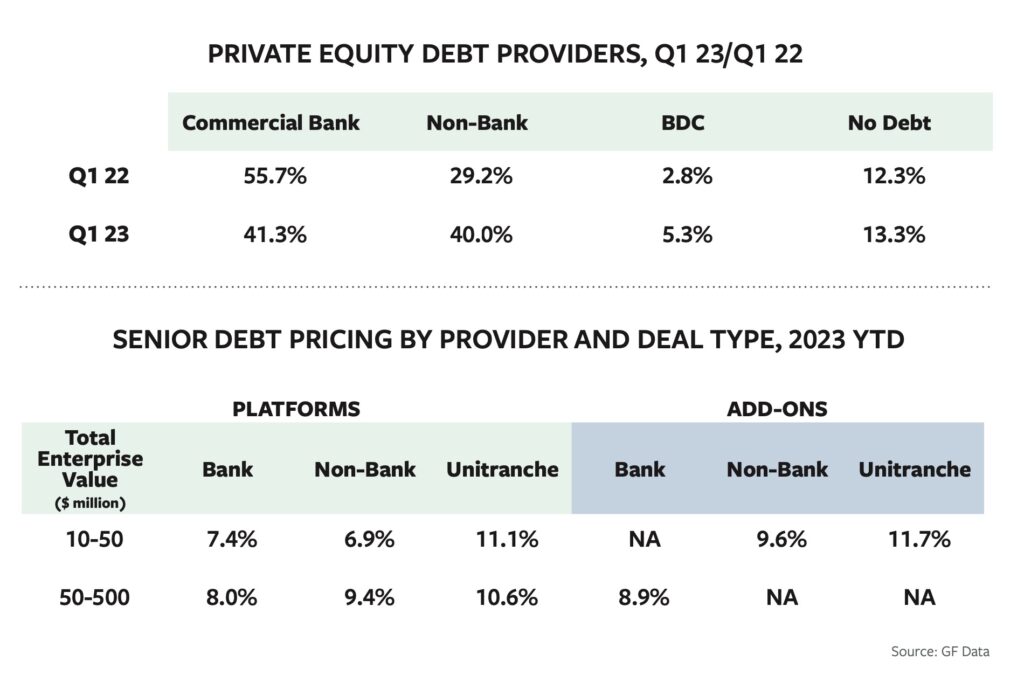
On the positive side we noted a rather large group of platform deals valued between $10 million and $50 million with an average purchase price multiple of just over 12x.
At the other end, we saw a noteworthy number of manufacturing and distribution businesses valued between $50 million and $250 million trading below 5x. It appears that in a rising interest rate environment, business owners decided—or were compelled—to sell for fear that additional disruptions to the debt markets would kill their chances later in the year.
We see further evidence of the dichotomy when we investigate the spread in frequency and purchase price for above-average financial performers. (GF Data defines above-average financial performers as companies with a minimum 10% EBITDA margin and a minimum 10% TTM revenue growth.)
In 2022 through the third quarter of that year, GF Data recorded the highest incidence of above-average financial performers since inception, comprising 71% of transactions reported. Since then, that trend has reversed, with above-average financial performers comprising just 53% of completed deals in the first quarter of 2023—on par with the historical average of 53%. This tells us that in the first quarter of 2023, more average companies traded and at more average prices. (The premium for above-average financial performers also reached a historic high in the first quarter of nearly three turns of EBITDA—9.2x versus 6.4x for other buyouts.)
Related content: GF Data Report: Q2 Brings Record Low Deal Volume
In addition to higher interest rates, the makeup of the debt market also changed in the first quarter, which saw a decrease of more than 14% in commercial bank financings and an increase of more than 10% in non-bank financings. (See chart.)
Average equity commitments from reporting private equity firms also increased in the first quarter. GF Data’s reporting private equity groups committed an average of 59% equity to first quarter investments, in part to make up for declining debt.
Senior debt contribution across all platform deals decreased to 30.5% in the first quarter, down from an average of 34.1% for all of 2022, while the average subordinated debt contribution fell to 10.5% from an average of 11.2% last year.
Bob Dunn is managing director of GF Data, an ACG company. GF Data collects and reports on platform and add-on acquisitions completed by private equity funds and other deal sponsors in the $10 million to $250 million enterprise value range. Over the course of this year, GF is extending the range to $500 million.

Middle Market Growth is produced by the Association for Corporate Growth. To learn more about the organization and how to become a member, visit www.acg.org.