The New Normal for Middle-Market M&A
Dealmakers face a more disciplined and structurally different debt market than pre-2022

For anyone who financed a leveraged buyout in 2021, the memory of cheap, abundant debt is vivid. Leverage ratios were generous, equity contributions were moderate, and senior debt was plentiful.
Then came the rate shock of 2022 and 2023, and the financing land scape for PE-backed middle-market acquisitions shifted more abruptly than at any point since the global financial crisis.
What emerged from that disruption is not chaos. It is a recalibrated market—more disciplined and structurally different from the pre 2022 cycle in ways that have proven durable through 2025 and into 2026, data from GF Data shows.
So, what’s the current state of middle-market debt?
This section of the report originally appeared in the Fall 2026 Events Preview issue of ACG Magazine.
The headline answer is roughly the same as three years ago but achieved differently. Debt coverage across all deals tracked by GF Data peaked at an average of 4.0x trailing 12-month (TTM) EBITDA in 2021 at the height of the post-COVID deal surge. It then declined to a trough of 3.6x in 2023 as rates rose sharply and stayed there more or less before jumping to 3.9x through the first quarter of 2026—almost reaching 2021’s mark and above the historical aver age of 3.7x.
Senior debt followed a similar arc over the same period, peaking at 3.3x TTM EBITDA in 2021 before dropping to lows in 2023 and 2025 of 2.9x and then rebounding to 3.3x in the first quarter.
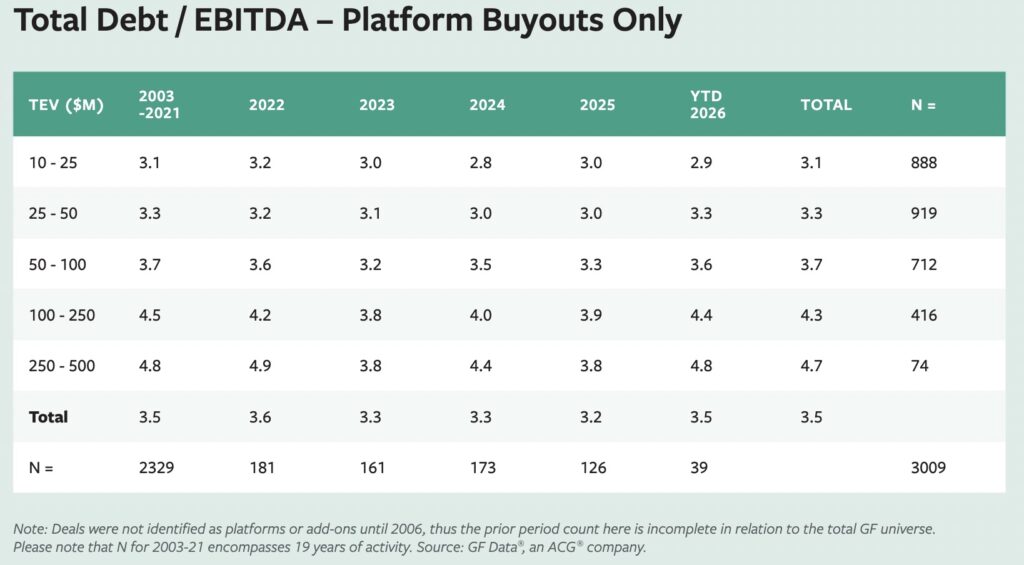
When looking only at platform deals, however, the recovery was more muted. After reaching an average of 3.7x TTM EBITDA in 2021, platform total debt coverage bottomed out in 2025 at 3.2x before recovering to 3.5x in the first quarter, still lagging 2021’s high-water mark. Coverage on senior debt for platforms was even more constrained, falling from a high of 2.9x TTM EBITDA in 2021 to a low of 2.3x in the first quarter and defying the overall upward trend in debt coverage.
Still, the most recent five quarters tell a positive story. Total debt cover age across all deals rose gradually from 3.7x in Q1 2025 to 3.8x in Q4 2025 before moderating to 3.7x in Q1 2026, while senior debt coverage climbed from 2.7x in Q1 2025 to 2.8x in Q4 2025. The direction of travel has been consistently upward—a signal that lenders have absorbed the rate shock and are incrementally more willing to extend more credit.
Capital Stack Shuffle
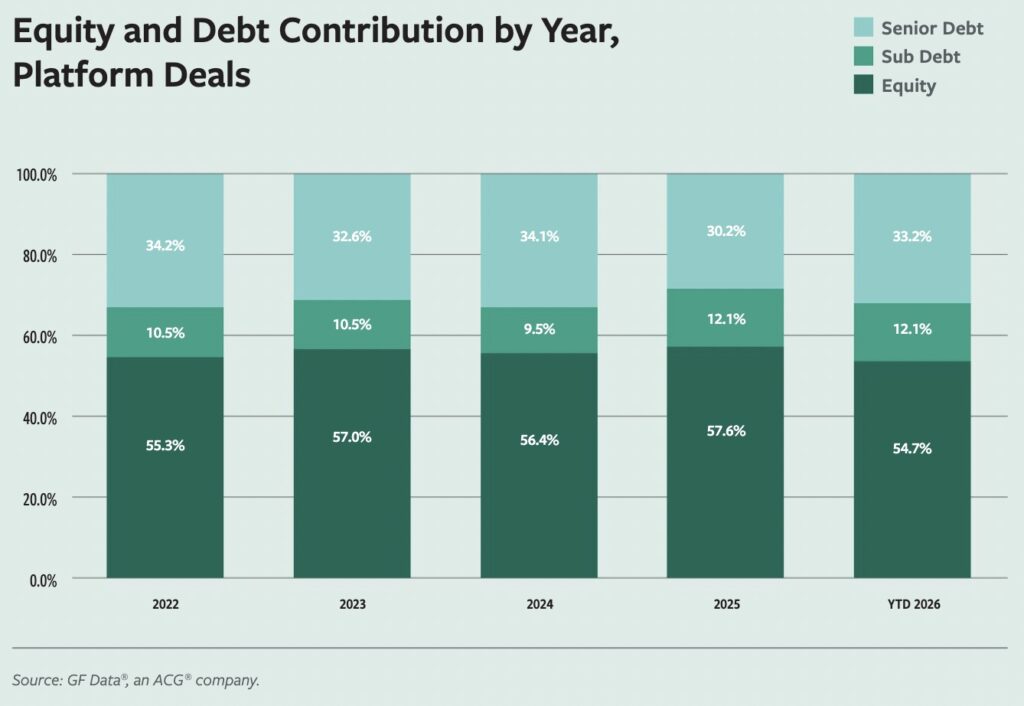
The rise of equity contribution defined much of the 2021–2025 period in middle-market financing. Equity (inclusive of sponsor and rollover) accounted for an average of 53.6% of platform deal value in 2021 and rose to 57.6% last year, the highest tally recorded by GF Data.
Senior debt contribution on platforms followed a reverse trend line, falling from an average of 36.8% in 2021 to a low of just 30.2% last year.
Much like debt coverage, the prevailing trend in equity contribution reversed in the first quarter, with average equity contribution falling to 54.7%—just 60 basis points above 2021’s average—and average senior debt contribution jumping to 33.2%.
Pricing Power
The rate shock has produced a new pricing baseline that shows only modest signs of easing. Bank senior debt more than doubled in cost over a three-year period, rising from 4.2% in 2021 to a 2024 peak of 7.8%, while unitranche pricing climbed from 7.8% to 12.1% (all pricing inclusive of SOFR).
The modest softening in 2025—bank senior at 7.6%, unitranche at 11.9%, and sub/mezz coupon at 13.5%—confirms that a higher-rate equilibrium has been established rather than a cyclical reversal.
The five most recent quarters show consistent and gradual easing across all lender types. Bank senior has declined 30 basis points from Q1 2025 to Q1 2026 (7.7% to 7.4%), unitranche has eased 40 basis points (12.0% to 11.6%), and sub/mezz has declined 40 basis points (13.6% to 13.2%). This is not a dramatic loosening—it is a market absorbing the rate shock and normalizing at a structurally higher level than the pre-2022 era.
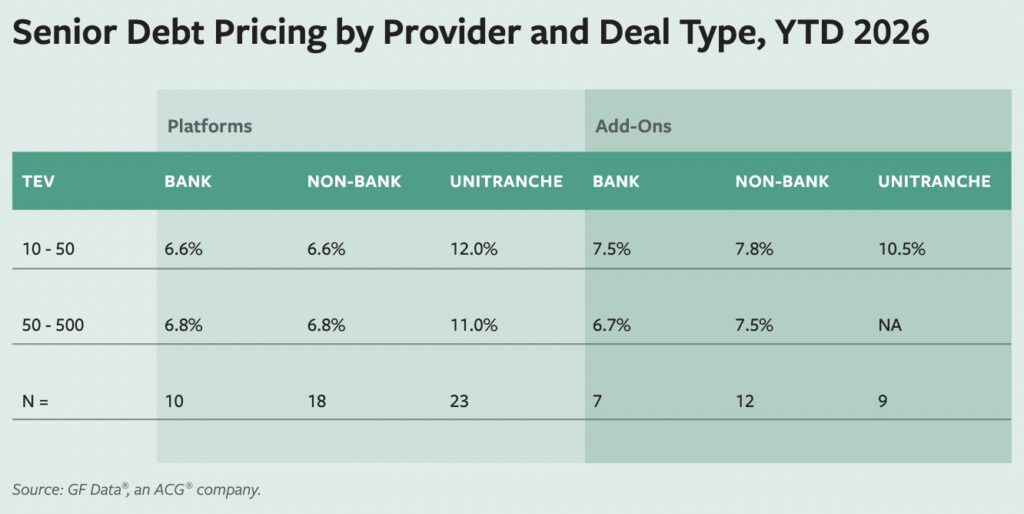
The pricing differential between bank and alternative lenders has become one of the most consequential variables in deal structuring. The bank/unitranche spread at the $10 million to $25 million total enterprise value (TEV) level runs approximately 450 basis points (bank senior at 7.5% versus unitranche at 12.0%), compressing to approximately 280 basis points at the $100 million to $250 million TEV tier (bank senior at 8.1% versus unitranche at 11.1%).
Bank lenders continue to dominate senior debt provision for the $10 million to $100 million TEV tier, with pricing averaging between 7.5% and 8.5%, while mezzanine lenders more selectively fill gaps in riskier or larger transactions, particularly above $50 million in enterprise value.
The choice between these alternatives is not merely a pricing decision—it involves covenant structures, amortization requirements, and execution speed. Unitranche solutions offer flexibility at a cost; bank facilities offer price efficiency with structural constraints.
The disparity in subordinated debt pricing across deal size tiers may be the least appreciated data point in middle-market PE-backed deals. All-in mezzanine pricing last year for deals in the $25 million to $50 million TEV range averaged 15.4% compared with 14.3% for $100 million to $250 million TEV transactions—a 110 basis point differential—while in the first quarter, the differential was 230 basis points (16.1% for deals valued between $10 million and $25 million versus 13.8% for deals valued between $50 million and $100 million).
These differences represent a meaningful return headwind for sponsors of smaller acquisitions. For a business generating $3 million in EBITDA financed with a modest sub debt tranche, the increased premium adds up quickly over a five-year hold period.
For sponsors, advisors, and business owners contemplating trans actions in the current environment, the data delivers a clear message: The market is there, the buyers are engaged, and the debt is available—but the terms are set by a market that has permanently repriced the cost of risk.
Bob Dunn is ACG’s Chief Product Officer.
ACG Insights is produced by the Association for Corporate Growth. To learn more about the organization and how to become a member, visit www.acg.org.