Rollover Equity Rises as Credit Conditions Reshape the Middle Market
A look at how rollover equity has emerged as a defining feature of today's deal landscape

As they contend with higher interest rates and tighter lending conditions, dealmakers are finding new ways to make transactions work. Debt has become both costlier and harder to come by, and equity has taken on a larger role, with one form in particular reshaping how deals are done.
Rollover equity—the ownership stake sellers retain and reinvest alongside buyers—has become a defining feature of today’s deal landscape. Once primarily a tool for aligning incentives, rollovers are now critical to bridging financing gaps and sustaining valuations in a constrained credit environment.
Market Reset Without Collapse
Rollover equity’s rise has unfolded against a backdrop of remarkably stable valuations, even as middle-market deal activity has cooled from its 2021 peak.
According to GF Data, the average total enterprise value (TEV)/trailing 12-month (TTM) adjusted EBITDA multiple for deals in the $10 million to $500 million range peaked at 7.6x in 2021 and held firm at 7.3x through the first three quarters of 2025, only modestly below the highs of the cycle. Even as volume normalized, sellers of high-quality businesses continued to achieve strong outcomes.
During that period, however, debt that once fueled the buyout machine became scarcer and more expensive, forcing sponsors to rethink how they capitalize transactions. The turning point came in 2022 as the Federal Reserve’s tightening cycle began to ripple through the credit markets. GF Data’s leverage metrics capture the shift.
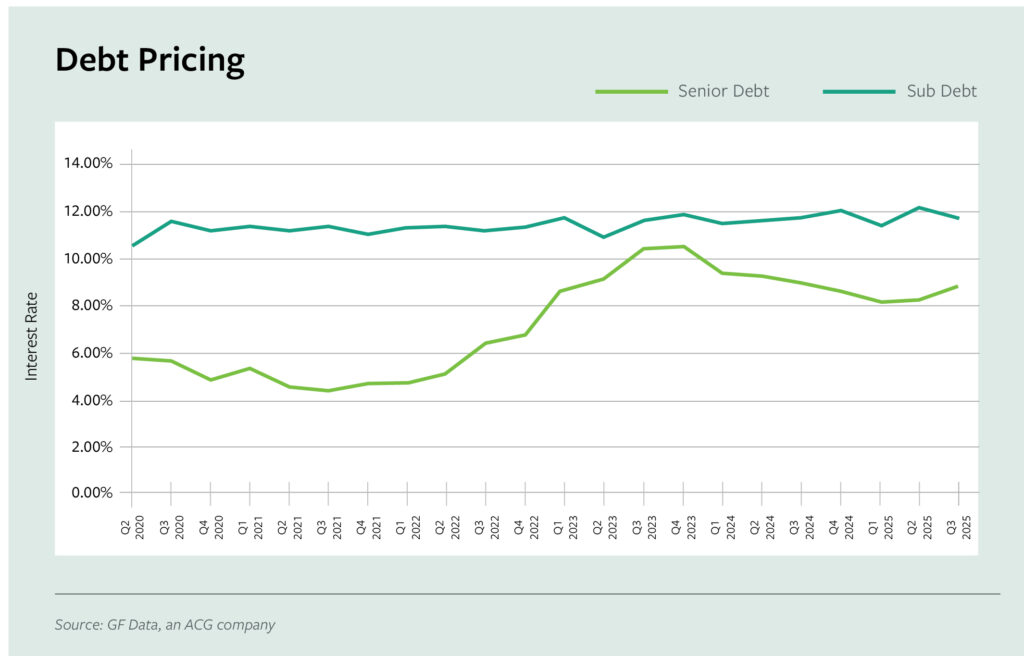
Total debt/EBITDA for platform buyouts fell from 3.7x in 2021 to 3.2x through Q3 2025, while senior debt/EBITDA slid from 2.9x to 2.3x over the same span. At the same time, debt pricing has more than doubled. Average senior debt pricing that hovered near 5% in 2021 now sits closer to 8–10%, while subordinated debt remains in the 11–12% range. The result is a thinner debt layer beneath valuations that have remained surprisingly stable.
Sponsors looking to maintain their target equity returns have had to fill that gap creatively. As financing costs climbed and lenders demanded tighter terms, sponsors began leaning more heavily on structural alignment to bridge valuation expectations, bringing sellers back to the table not just as counterparties but as co-investors.
Story continues below.
The Rise of Rollover Equity
Few tools have proven as effective at bridging the financing gap as rollover equity, which has evolved into a primary mechanism for closing transactions in today’s constrained credit market.
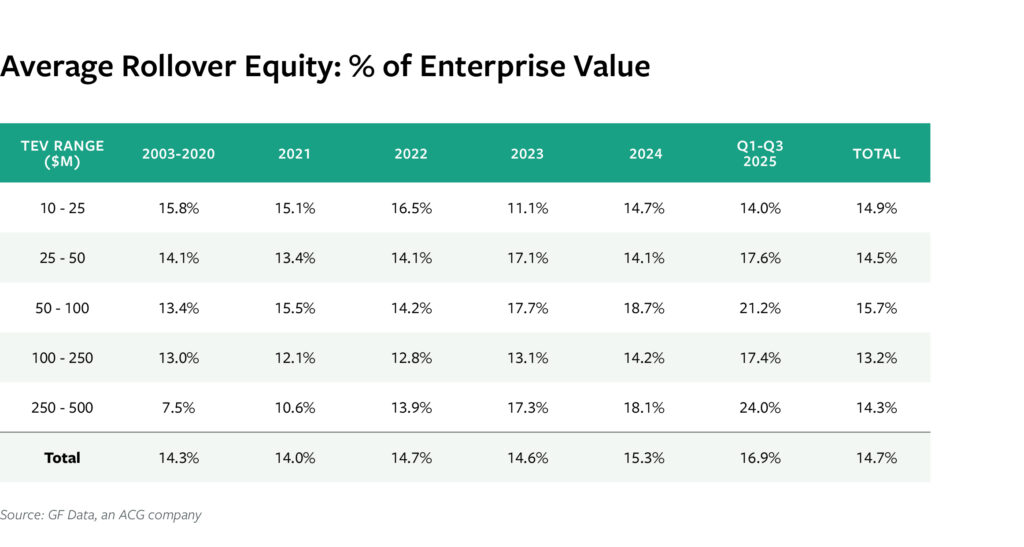
Rollover equity has climbed steadily in recent years. Across all deal sizes, the average rollover as a share of total enterprise value has risen from 14.0% in 2021 to 16.9% through Q3 2025, according to GF Data. The increase aligns closely with the contraction in available leverage.
By deal size, the upward drift between 2021 and Q3 2025 is visible across the board. (See Chart ‘Average Rollover Equity’) Rollover equity remained relatively consistent over the period in the smallest size tier but rose in tiers above $25 million. For the $250 million to $500 million tier, the rise was sharpest, nearly doubling from 10.6% in 2021 to 24.0% in 2025, as larger sponsors turned to seller participation to complete financings amid shrinking lender appetite.
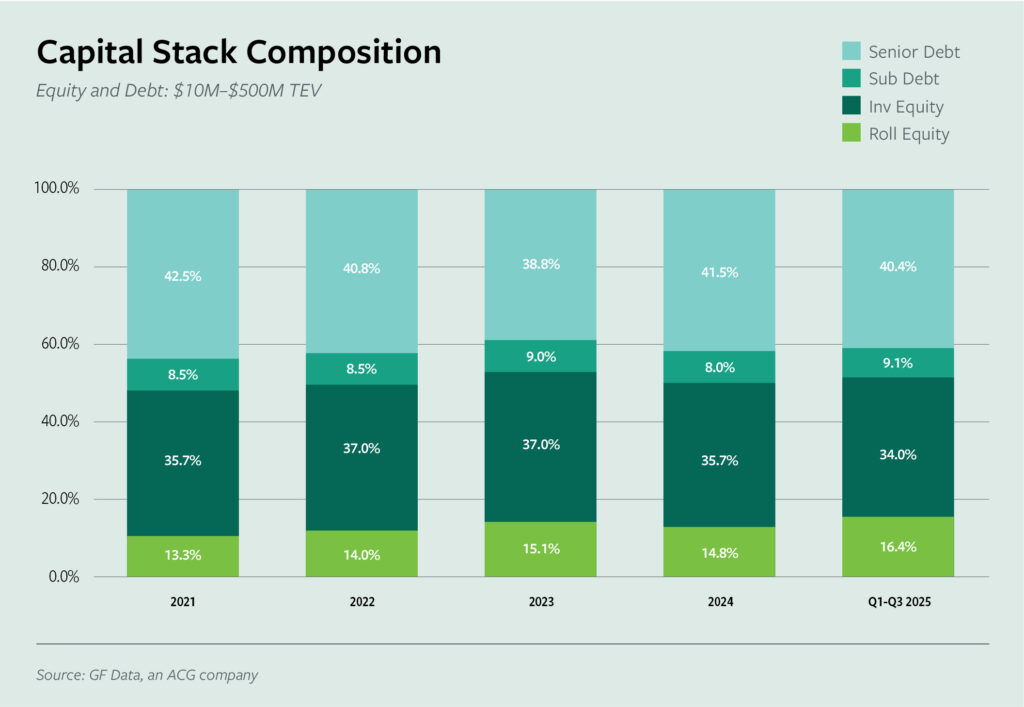
This shift is also visible in the broader capital stack. Since 2021, the share of rollover equity within total capitalization has grown from 13.3% to 16.4%, while senior debt’s share has declined from 42.5% to 40.4%. Chart ‘Capital Stack Composition’ reflects only senior and subordinated debt, with unitranche facilities removed to ensure consistency across years. That adjustment highlights the relative contraction in traditional lending even as private credit and blended structures have contin ued to support middle-market deal activity.
Story continues below.
A Bridge and a Bond
Rollover equity functions as both bridge and bond in today’s deal structures. Financially, it bridges the funding gap left by retreating lenders. Behaviorally, it bonds sponsors and sellers through continued ownership and shared performance. Instead of walking away from strong but capital-intensive businesses, sellers can stay invested, sharing both risk and future upside with their financial sponsors. Rollovers offer participation in the company’s next growth phase while mitigating the timing risk of exiting into a softening market.
For sponsors, rollovers reduce the initial equity check and cushion IRR compression amid higher borrowing costs. This alignment between buyers and sellers has tangible benefits. Deals with significant rollover stakes often move faster through diligence and post-closing integration because both sides share a long-term mindset. The structure transforms what could be a pure financial transaction into a partnership. Outlook: Structural, Not Cyclical Even if interest rates ease and leverage rebounds modestly, we don’t expect rollover equity to revert to pre-2020 levels. The strategy has proven too useful, not just as a stopgap but as a structural feature of disciplined dealmaking.
Looking ahead to 2026 and beyond, rollover equity is poised to remain elevated, reflecting an evolved middle market that prizes alignment as much as leverage. In an environment where traditional credit channels are still recalibrating, sponsors and sellers alike have discovered that the best deals are built not only on capital but on shared conviction.
Ryan McCann is Senior Middle-Market Analyst, GF Data.
Middle Market Growth is produced by the Association for Corporate Growth. To learn more about the organization and how to become a member, visit www.acg.org.