New Research Brings Private Company Data into Public View
Lincoln International's new index looks at changes over time of the value of private midsize companies, a market segment lacking in research.

Corporate finance, security analysis and asset pricing rely on investors’ ability to evaluate portfolio choices, yet investing in the private markets remains an understudied and underreported sector of the U.S. economy.
A new index from investment bank Lincoln International is among the first to look at changes over time of the value of private middle-market companies, giving investors insight into the largest segment of the private markets—and one lacking in research.
Whether investing in public or private companies, high-quality and reliable data is the foundation for measuring risk, return and shareholder value creation. The Lincoln Middle Market Index, or MMI, provides insight into the returns generated by private middle-market companies, due to performance or changes in valuations, and it shows how performance varies across a range of industries in the middle market. Until now, this type of information has been available only for publicly traded companies.
Using financial data provided by approximately 100 private equity and debt funds in its client roster, Lincoln values more than 1,200 private companies quarterly. The Lincoln MMI uses this data to measure the quarterly change in enterprise value of hundreds of U.S. private middle-market companies from 2014 to today. It also reveals how changes in company earnings and market multiples each affect companies’ enterprise value, which includes both equity and debt.
It is well known that private companies form the backbone of the U.S. economy and are responsible for significant levels of employment and wealth creation.
Pulling Back the Curtain
Private companies are only required to file an annual tax return, so it’s difficult to obtain sufficient information to understand the risk and return associated with a prospective investment. And it is extremely difficult—if not impossible—to obtain data related to the performance of investments in private companies. Public companies, by contrast, are bound to transparency due to reporting requirements of earnings and other material information by the Securities and Exchange Commission.
Privately held companies are not subject to the short-term earnings focus of public companies, which are required to report earnings every quarter. Furthermore, private companies are not subject to regulatory scrutiny from the SEC and the Public Company Accounting Oversight Board, nor to involvement from activist investors.
It is well known that private companies form the backbone of the U.S. economy and are responsible for significant levels of employment and wealth creation. According to the U.S. Small Business Administration, private companies employ approximately half of the labor force; these companies also generate approximately half of U.S. economic output.
What the Index Reveals
The Lincoln MMI, comprising approximately 350 private companies, grew at a compound annual growth rate of 6 percent between March 30, 2014 and September. 30, 2017. This compares with compound annual growth rates for public companies reflected in the large-cap S&P 500 index and small-cap Russell 2000 of 8.9 percent and 7.1 percent, respectively.
Relationship of the Lincoln MMI to the S&P 500 and Russell 2000 – Returns and Correlation
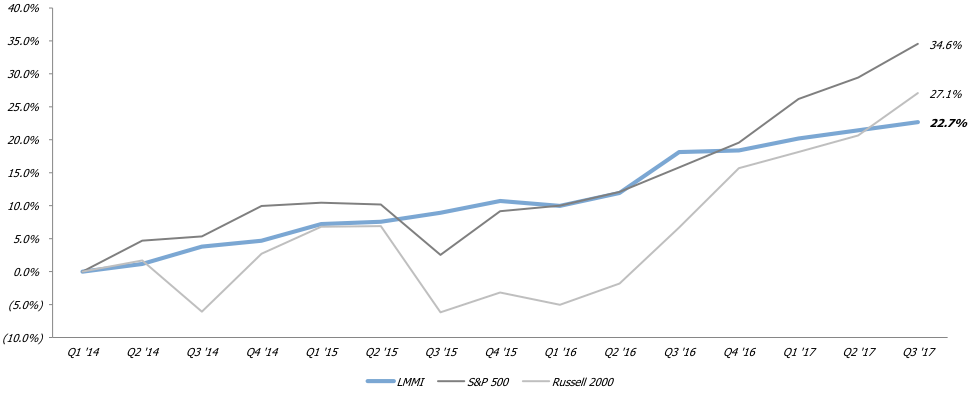
The relatively lower growth rate of private middle-market companies is likely due to differences in how changes among public and private companies are measured. Unlike the public indexes, whose growth is based on changes in equity values, the growth reflected in the Lincoln MMI is based on changes in enterprise value, which accounts for market capitalization and debt.
It is a reasonable assumption that equity returns associated with middle-market companies would have been substantially higher due to the impact of leverage of companies within the Lincoln MMI, putting them closer to par with their publicly traded peers.
Creating Shareholder Wealth – Changes in Market Multiples vs. Changes in Earnings
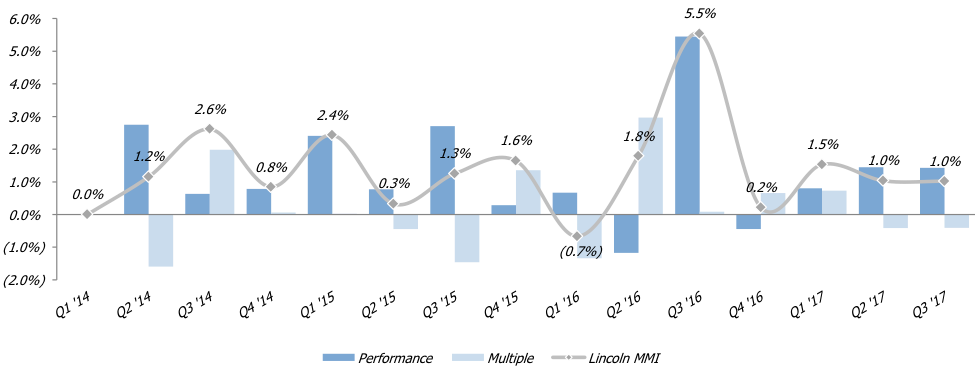
Since the inception of the Lincoln MMI in 2014, middle-market valuation multiples have expanded by approximately 10 percent. Lincoln’s research indicates that earnings drive the majority of growth related to shareholder value creation. The data show that the ability of management to increase earnings has a significantly more powerful impact on shareholder wealth creation as compared with changes associated with market multiples—such as EBITDA multiples or price-to-earnings multiples—increases.
The Lincoln Middle Market Index peers into what had previously been an opaque market. As a fair value index, the Lincoln MMI provides a snapshot of private middle-market company financial performance and value creation. Quarterly updates will continue to provide an important benchmarking tool that offers valuable insights to middle-market business owners and investors.


Larry Levine is a managing director in Lincoln International’s valuation and opinions group.
John Buley is a professor of the practice of finance at Duke University’s Fuqua School of Business. He is also a senior adviser to Lincoln International.