Unlocking the Power of Business Intelligence in Value Creation
Sapling Financial's Rob Hong explores how to transition to business intelligence

According to a recent ACG article, “tracking performance is table stakes for private equity-backed middle-market companies.” In our seven years of working with mid-market private equity firms, however, we’ve found few do it optimally.
We’ve seen three areas where the existing key performance indicator (KPI) tracking at private equity portfolio companies falls short. Most firms use Excel spreadsheets requiring extensive time from the portco finance team to prepare, meaning data is out-of-date by the time managers get their hands on it. Existing KPI tracking tends to rely on finance, pulling P&L data from systems like Sage, QuickBooks and NetSuite, and monitoring lagging indicators that aren’t directly controllable.
This section of the report is sponsored by Sapling Financial Consultants and originally appeared in the Summer 2024 issue of Middle Market Executive.
What it doesn’t usually do is pull from live operational systems that can provide leading indicators that are directly controllable by business managers. Additionally, existing reporting lacks relevance, as it’s almost impossible for a small finance team to distribute up-to-date Excel KPIs to all the appropriate stakeholders (e.g., to each regional manager, filtered for their region). All these issues stem from private equity firms living in their comfort zone—Excel and finance.
Leading-edge private equity firms are increasingly working around these limitations by setting up business intelligence systems (BI systems, or BI), either by building out proper BI teams under a Portfolio Support or similar group, or engaging trusted consulting firms. These systems use a front-end, client-facing visualization tool like Power BI or Tableau, and a back-end database solution like SQL that is populated with transaction-level data directly from various systems. Optimally, the BI systems extract and report on data from operational systems like phone loggers, medical practice management systems, CRMs, route planning apps, etc.
Think in terms of three levels of maturity for BI, corresponding to the three limitations already noted (see below). In the first, BI is used to automate some of the C-suite-directed, financially focused KPI work done by the portco’s finance team, saving staff time and increasing timeliness. This is helpful but undersells BI’s capabilities dramatically.
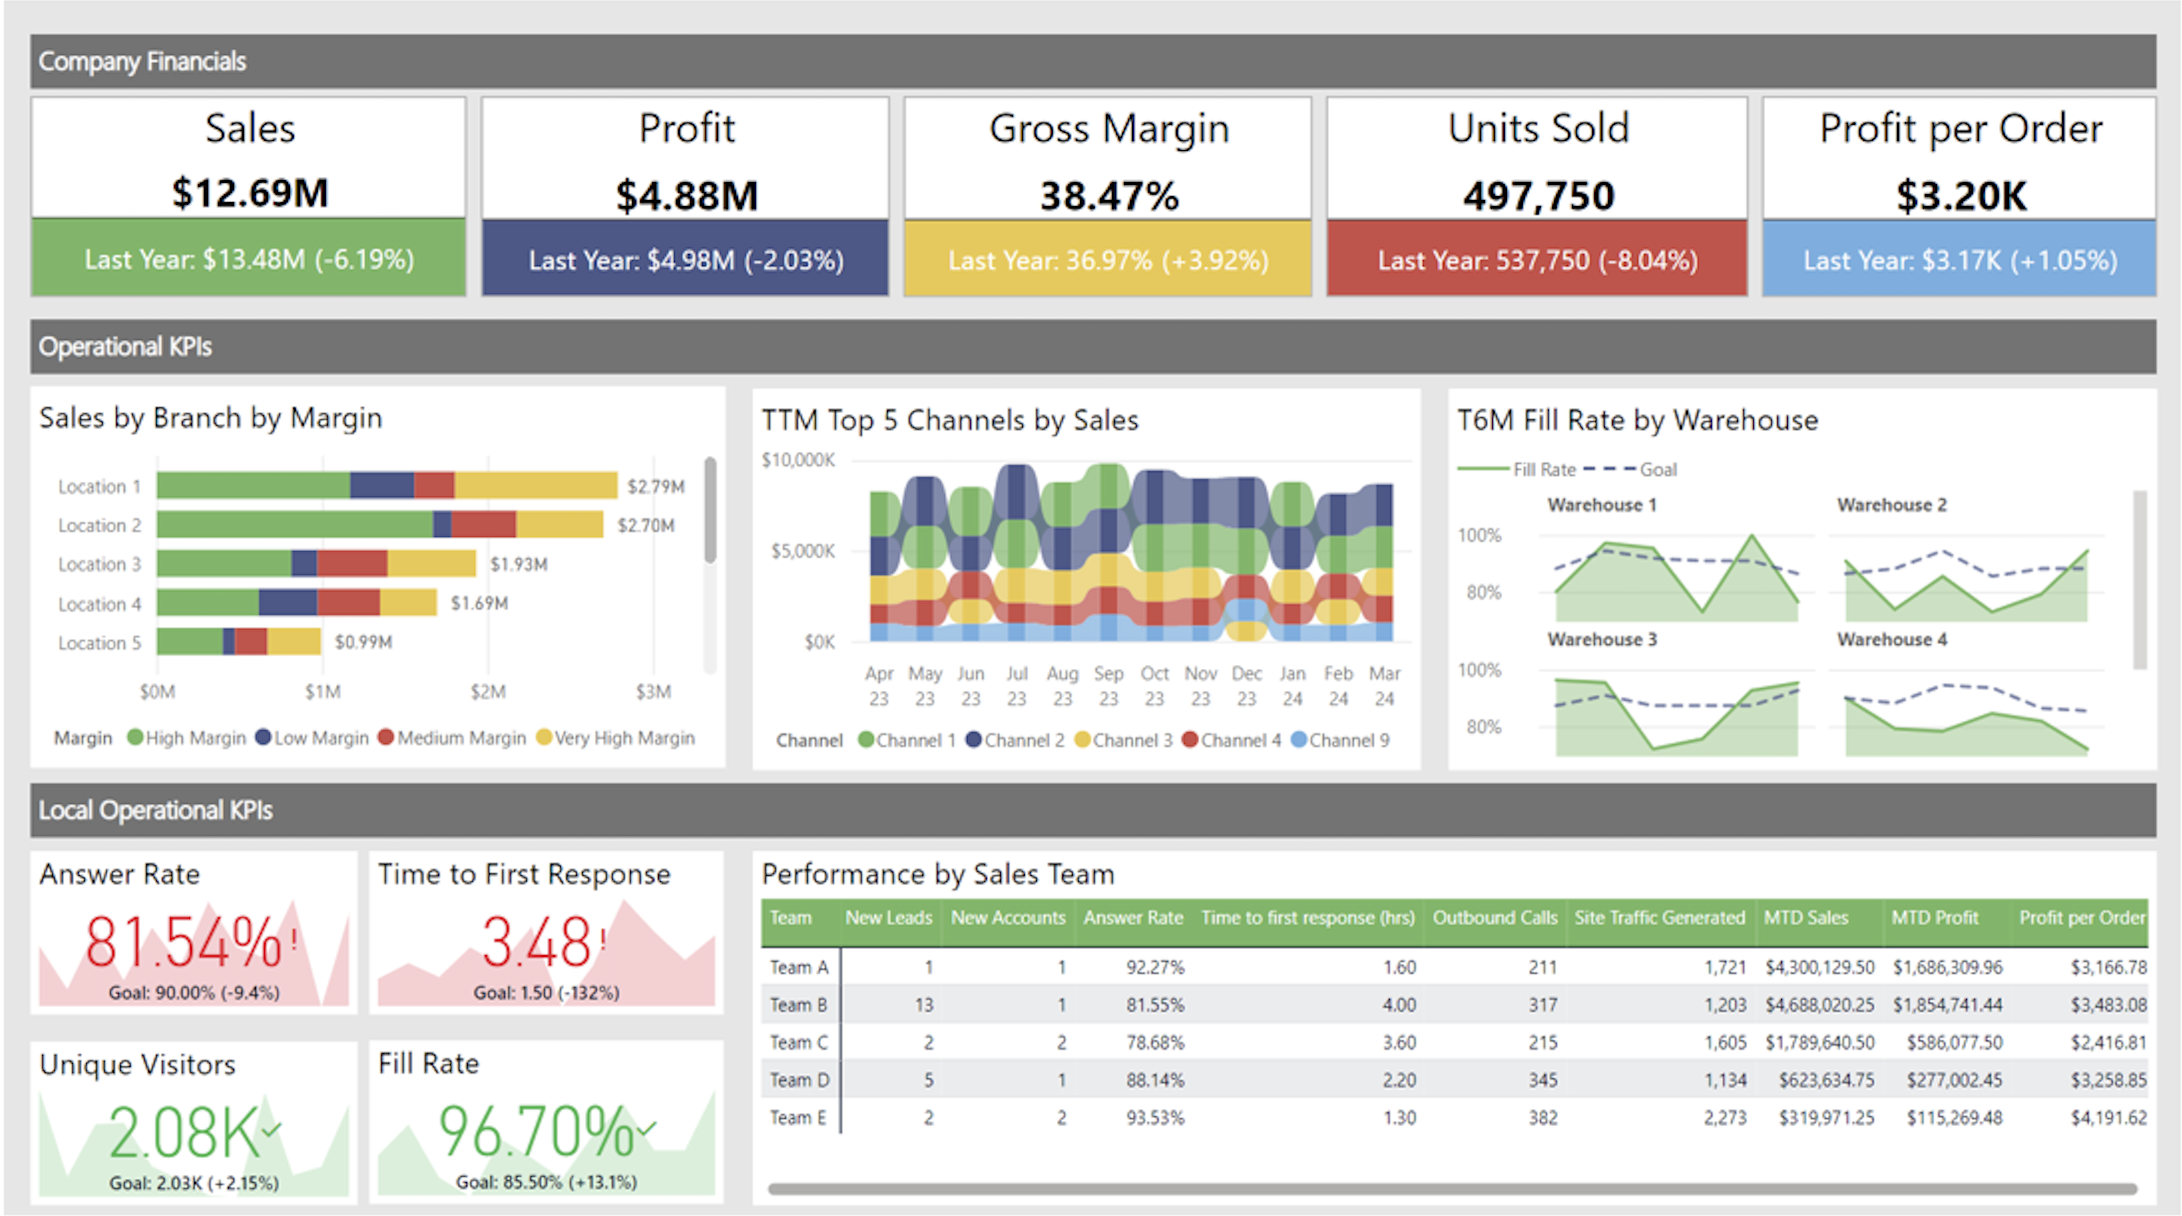
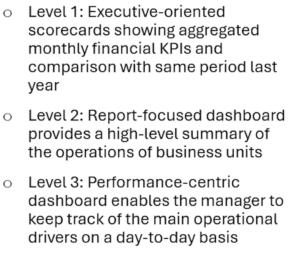
The second level involves measuring performance based on operational KPIs. We’ve now moved beyond lagging, difficult-to-control finance-focused metrics, but we’re still keeping the numbers cloistered inside a C-suite with sporadic and often limited ability to directly impact operational KPIs on a day-to-day basis—things like fill rate for the Detroit warehouse, phone answer rates for the Raleigh location, or shrink rates at the St Louis store.
The third level is where BI is used to manage performance at a KPI level. The Detroit warehouse manager, for instance, now has a dashboard showing fill rates by product line and shift. They know to focus on products and shifts with weaker fill rates, taking concrete steps like renegotiating shipping terms with suppliers, reconfiguring the warehouse to speed up fulfillment, and moving stronger foremen to weaker shifts.
Transitioning to BI requires a small shift outside one’s comfort zone, but for numbers-focused private equity sponsors, the payoff can be enormous.
Rob Hong is co-founder and CEO of Sapling Financial Consultants. Launched in 2015, the company provides bespoke financial modeling, FP&A, due diligence and data analytics services tailored for its clients. Learn more at saplingfinancial.com.

Middle Market Growth is produced by the Association for Corporate Growth. To learn more about the organization and how to become a member, visit www.acg.org.