How Much Does Deal Volume Inform Value?
How much impact does buyer demand have on pricing in the middle market? Private Equity Info and GF Data teamed up to investigate.

How much impact does buyer demand have on pricing in the middle market? Private Equity Info and GF Data teamed up to investigate.
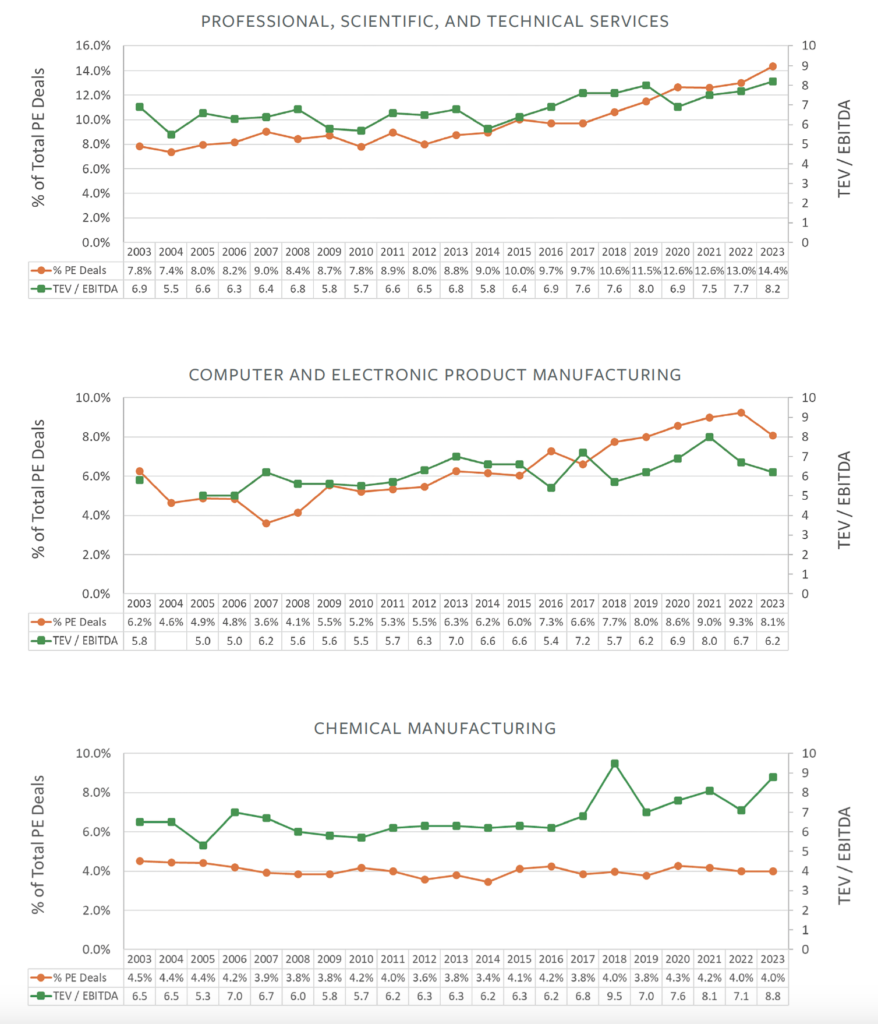
We overlayed the top four three-digit NAICS codes based on their share of deal volume over the past two decades using data from Private Equity Info—a research database used by M&A professionals—with valuation data from GF Data, an ACG company. We then tested whether increased demand by private equity groups translates into higher multiples over time.
The results were mixed.
In some industries with a high share of private equity deals, we see evidence that private equity acquisitions might create sufficient buy-side demand to increase valuations of companies in these sectors. Other industries show lower or no correlations between private equity acquisitions and valuation metrics.
Many private equity firms tend to have similar industry focuses over time; some industries are in vogue for private equity at certain times, while other industries cycle out of favor. Consequently, financial buyers, as a collective, can become heavily concentrated in select industries, and these concentrations are generally cyclical.
We selected four NAICS industry codes that have experienced the largest market share for platform acquisitions by private equity over the last 24 years. These include:
541 – Professional, Scientific and Technical Services, which grew in share of PE acquisitions by 56% over the 24-year period and represented 10.3% of total private equity platform acquisitions.
511 – Publishing Industries (except Internet), which grew by 71% and represented 7.5% of the deal total.
334 – Computer and Electronic Product Manufacturing, which saw 36% growth and a 6.8% share.
325 – Chemical Manufacturing, which fell by 13% over the 24-year period and represented 4% of completed deals. (Find market share ratings for other industries at privateequityinfo.com/trends.)
There was a high level of correlation (0.76) between deal activity and valuation for NAICS 541, which also represented the largest percentage of activity of the four industries. Heavy concentration of private equity acquisitions, coupled with substantial growth of private equity investments within a given industry, has the strongest positive impact on pricing.
For industries with increasing market share and a relatively high percentage of completed deal activity, it does appear that deal volume correlates to deal value.
The next two, NAICS codes 511 and 334 (with 7.5% and 6.8% share of total PE deal volume, respectively), proved more moderately correlated. Deal activity tracked by PEI for NAICS 511 had a 0.65 correlation with valuations from GF Data, while NAICS 334 had a correlation of 0.55.
Finally, we get to NAICS 325 (Chemical Manufacturing), which was the only NAICS code we analyzed that experienced a decline in deal volume based on PEI data. In this case, we found no correlation between deal volume and valuation, allowing us to draw the conclusion that a decrease in deal activity does not necessarily impact pricing, especially for cyclical industries.
The takeaway? For industries with increasing market share and a relatively high percentage of completed deal activity, it does appear that deal volume correlates to deal value. With those with decreasing market share and smaller percentage of deal activity, volume has less impact on value.
Bob Dunn is managing director of GF Data, an ACG company and the leading source of private deal valuations in the middle market.
Andy Jones is a managing director of TruSight PEI LLC (PrivateEquityInfo.com), an M&A research database designed for deal professionals.
Middle Market Growth is produced by the Association for Corporate Growth. To learn more about the organization and how to become a member, visit www.acg.org.