Private Equity’s Wild Ride Since COVID
What GF Data analysis finds from the last five years of middle-market M&A

It’s been a wild ride for private equity-backed middle-market M&A over the last five years.
The rollercoaster started with a bull market after the beginning of the COVID-19 pandemic, which saw deal volume tracked by GF Data reach record levels in 2021, accompanied by peak valuations. In their wake came supply-chain challenges, global conflicts, successive interest rate increases by the Federal Reserve, the second largest bank failure in history, the rise of alternative credit, and, most recently, tariff-related shock that has suppressed deal volume and tanked valuations for some sectors while improving them in others.
Boom Town
At the start of COVID, it appeared social distancing and remote work would sink M&A activity in the middle market. Between Q1 and Q2 of 2020, deal volume tracked by GF Data fell by nearly 60%, with just 40 deals completed in the second quarter. The following quarter, GF Data tracked 64 completed transactions.
But in the fourth quarter of 2020, deal volume spiked to 141 completed transactions as buyers became more competitive in pricing, and pushed average valuations to 7.6x trailing 12-month (TTM) EBITDA in the following quarter.
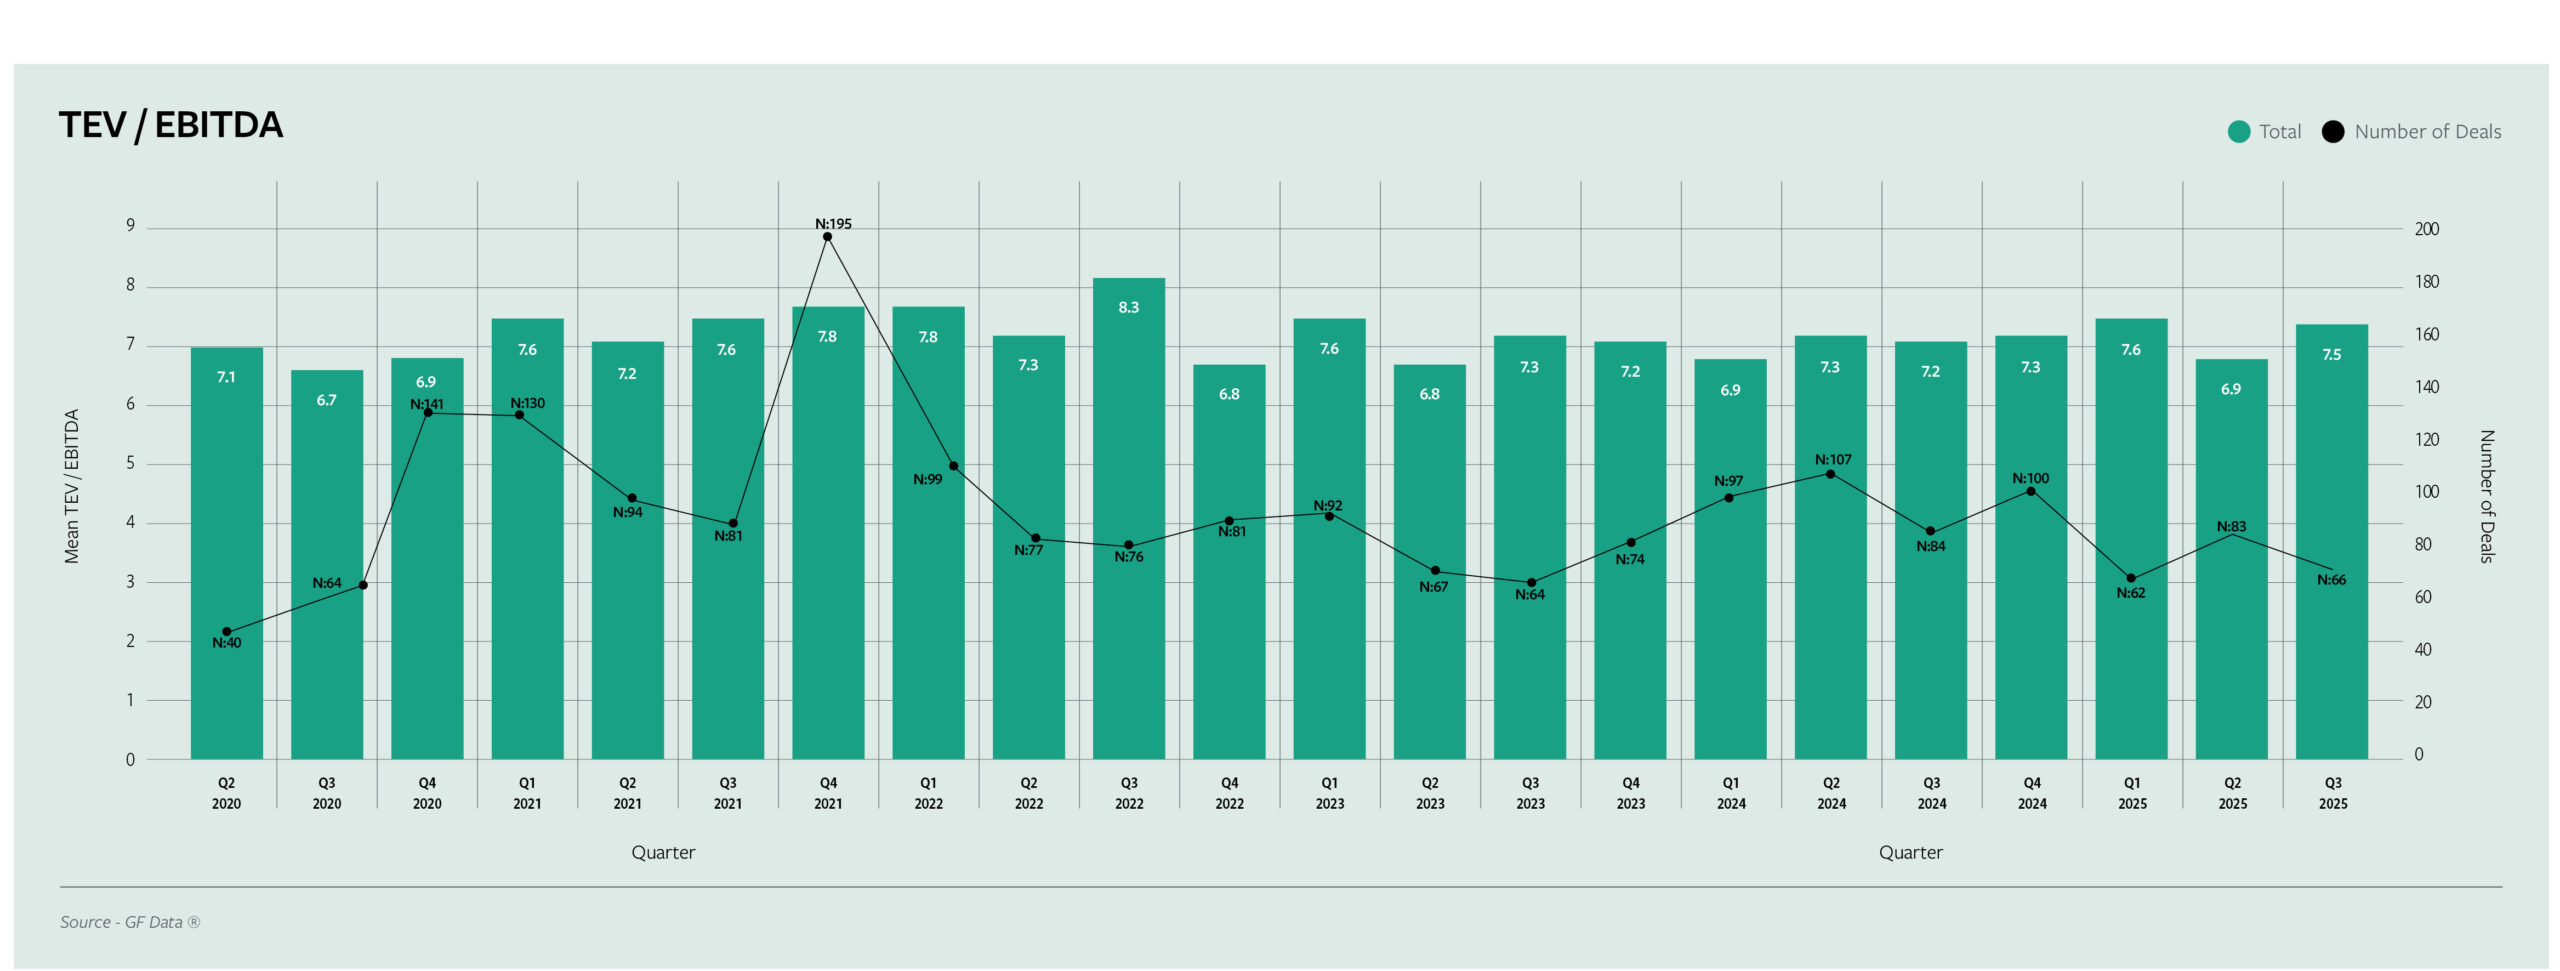
The following year ushered in peak deal volume, with 501 completed transactions tracked by GF Data. Valuations reached 7.6x TTM EBITDA for the year, with an average of 7.8x in the fourth quarter and the first quarter of the following year. These inflated valuations became the basis for seller expectations on deal values and hampered deal flow in 2022 and 2023.
Meanwhile, in this hyper-competitive environment, private equity adapted to streamlined diligence processes that allowed deals to close more quickly but did not provide the depth of insight on target companies that had been available prior to the COVID deal boom.
Supply Chain & Employment
Supply-chain challenges started at the beginning of COVID but did not become endemic until several months into the lockdown, when consumers shifted spending previously reserved for entertainment and dining out and instead put that money to work on home improvement, electronics, and consumer goods. This whipsaw made forecasting inventory more challenging and led to product shortages. Labor shortages also hamstrung distribution, leading to delivery delays and higher costs on raw materials for manufacturing and services businesses alike.
Lean Leverage
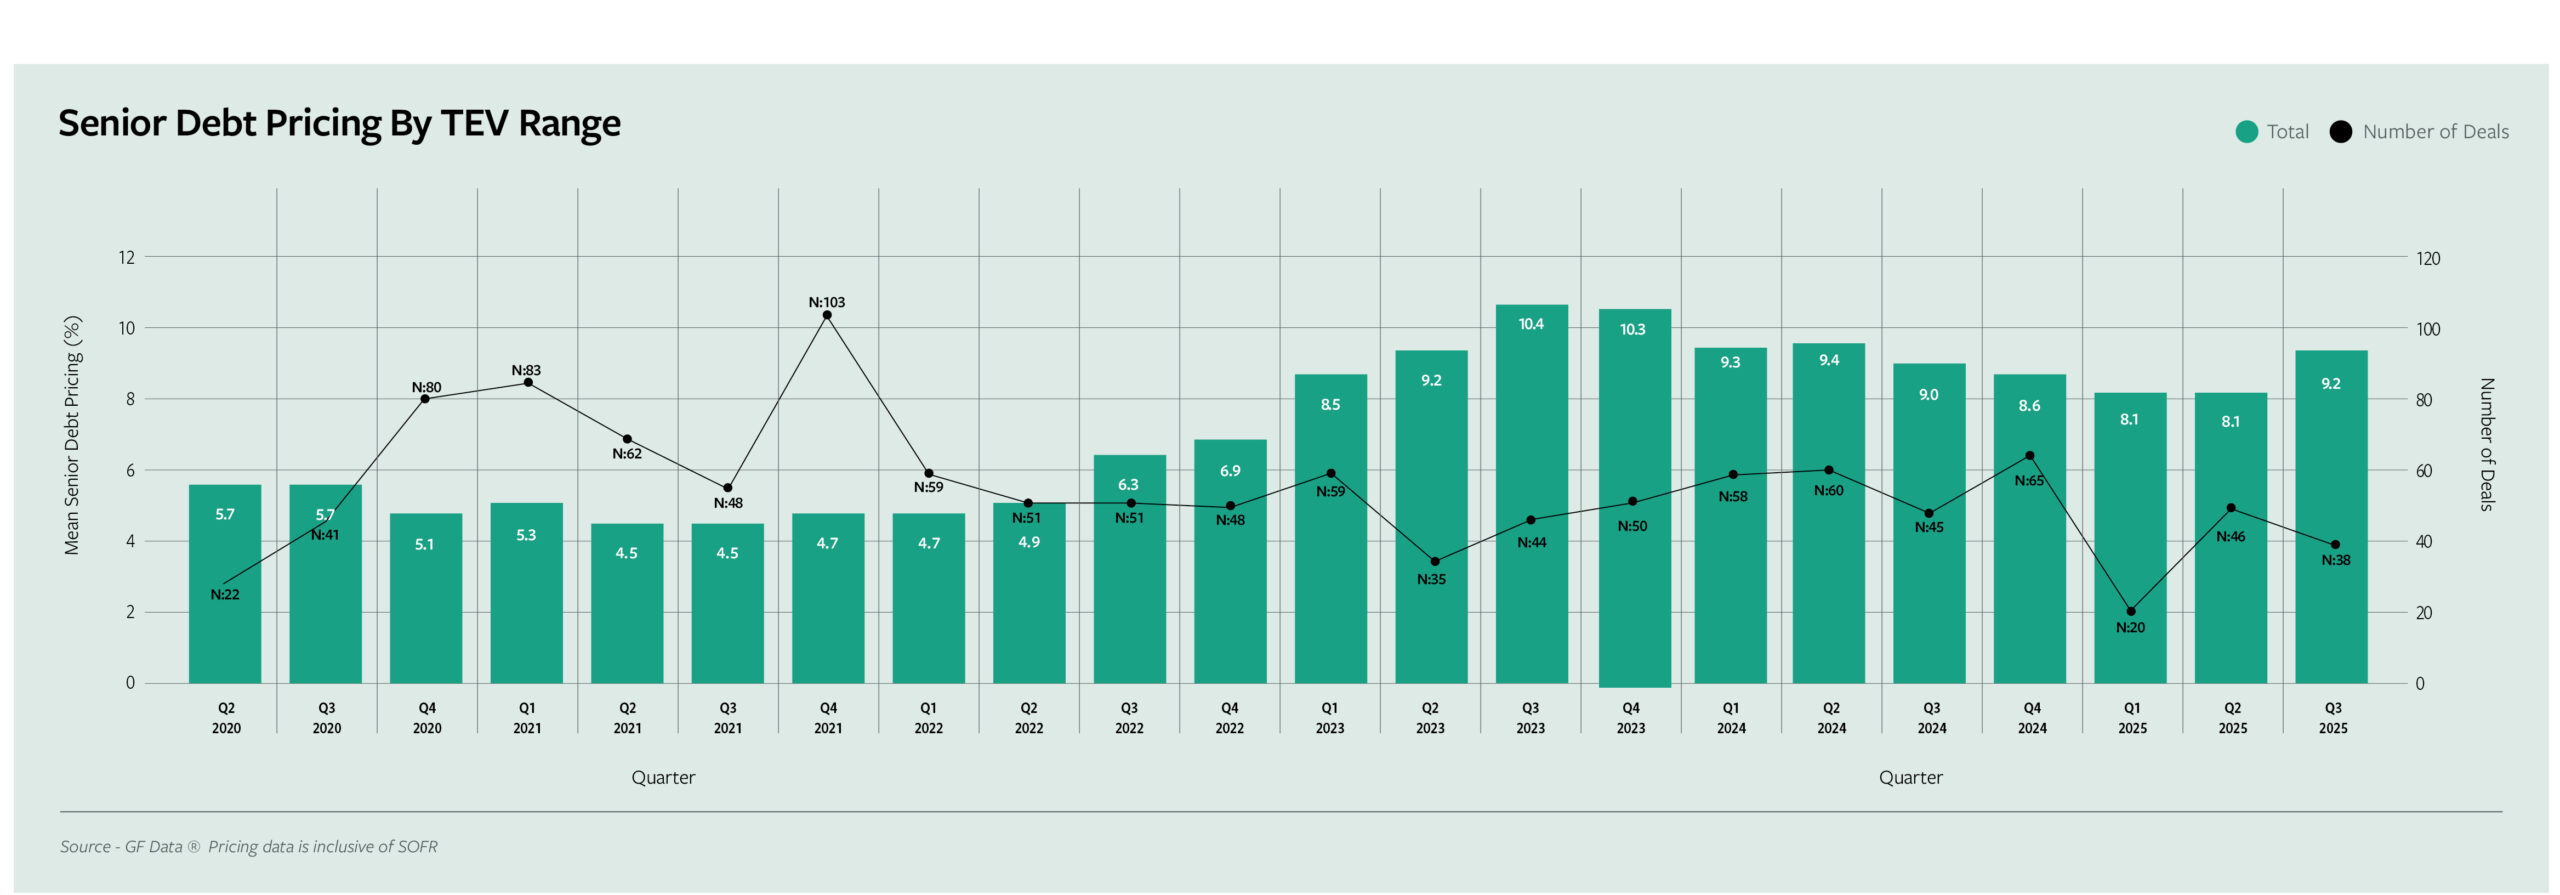
Against this backdrop, the middle-market debt landscape underwent a fundamental repricing. Ninety-day trailing SOFR sits at 4.3% at the time of this writing in November. While that’s just off the peak reached in June of 2025, spreads for lever aged loans remain wide—typically SOFR + 550–700 bps for first-lien structures and higher for subordinated tranches. What was once a 6% cost of debt is now closer to 10% in this market.
Banks remain constrained by regulatory capital requirements and internal risk limits. As a result, direct lenders and BDCs dominate the space—but even they are exercising pricing power and tightening terms. Unitranche deals that once featured light covenants now include maintenance tests, enhanced reporting, and amortization schedules that would have been out of place two years ago. Buyers with captive credit platforms, permanent capital, or unlevered balance sheets are outmaneu vering traditional PE funds that depend on third party debt.
Banking Blowup
While the Federal Reserve began its tightening cycle in late 2022, rate increases accelerated markedly with the failure of Silicon Valley Bank in March 2023, the second largest banking failure in history. SVB’s failure spooked commercial banks due to the bank’s concentration in lending to and servicing venture capital firms and startups. Although private equity did not factor into SVB’s client base, the link to alternative assets and potential systemic banking risk was underscored by the bank’s failure and caused commercial banks to pull back from leveraged lending for the rest of 2023 and into the first half of 2024.
Tariffs Take a Bite
Despite the market challenges experienced in 2022 through the middle of 2024, the market appeared to be on an upswing in the second half of that year. GF Data tracked 388 completed transactions in 2024, the second highest total since 2021 and an increase of 31% over the prior year. Add-on activity proved more prevalent that year, reaching 40% of deals tracked by GF Data, compared to 33% in 2023.
That changed in the first quarter of 2025, as concerns over tariffs pushed deal volume down by nearly 40% compared to the prior quarter, and companies with less tariff exposure—such as those in business services—saw increased average valuations.
Through the first three quarters of 2025, average valuations on manufacturing deals were down three-tenths of a turn compared to the prior year, while average valuations on business services deals were up the same amount. Annualizing deal data for 2025 forecasts a decline in deal volume for the year of more than 24%, which would make for the lowest tally of completed deals tracked by GF Data since 2017.
Bob Dunn is Chief Product Officer, ACG.
Middle Market Growth is produced by the Association for Corporate Growth. To learn more about the organization and how to become a member, visit www.acg.org.