New Fields, New Fruit: Digging Into GF Data’s Newly-Added Data
GF Data digs deeper into M&A data from the last four quarters

Across the last four quarters (spanning Q3 2024 to Q2 of this year), nearly 50% of deals tracked by GF Data included a sell-side quality of earnings (QoE), almost 30% of all deals tracked closed 12 months or more after the date of letter of intent (LOI), and the Southeast and Midwest recorded the highest regional deal volume across the U.S. and Canada.
GF Data began tracking these new fields with the relaunch of our online database late last summer. This marks the first time these results are being published. (These fields will be added to the database in a subsequent release.)
With the addition of these data points, we hope to bring even more clarity to middle-market, private equity-backed activity (defined as companies with total enterprise values (TEV) between $10 million and $500 million).
Small Deals Gain Ground, Scale Still Commands a Premium
The headline numbers tell a simple story. Across the 360 deals GF Data tracked through the four-quarter period, companies that performed a sell-side QoE benefited on average with a sale price of nearly half a turn of EBITDA higher (7.4x for those that used a sell-side QoE, compared to 7.0x for those that did not).
However, digging into the data, the story becomes a bit more nuanced.
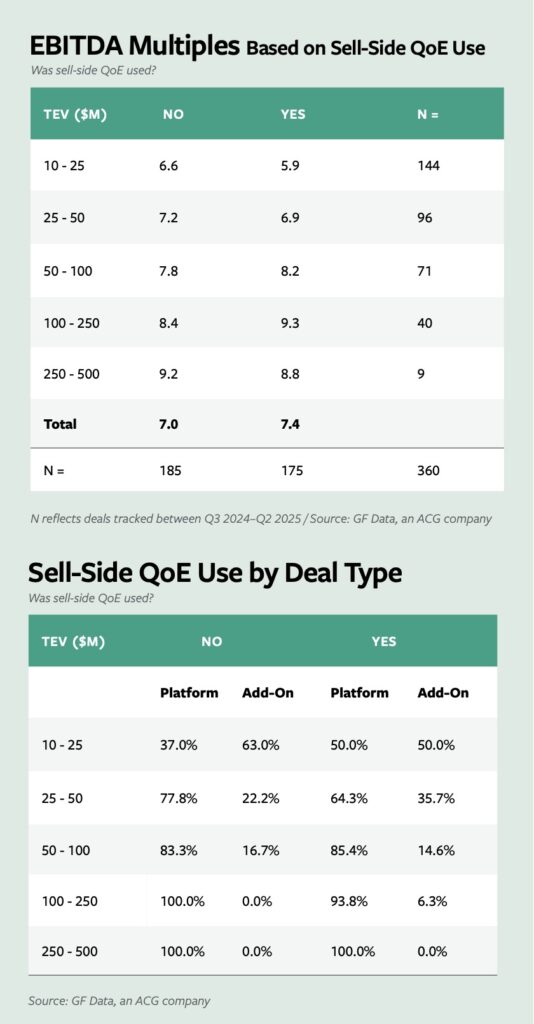
Overall, our analysis showed that conducting a sell-side QoE had little impact on valuation for transactions valued at less than $50 million. Indeed, companies in the $10 million–$25 million TEV range that conducted sell-side QoEs recorded lower valuations compared to companies in that size range that did not—5.9x vs. 6.6x. Companies valued between $25 million–$50 million that used a sell-side QoE saw 6.9x valuations vs. 7.2x for those that opted out.
One explanation for this comes from the transaction-type data in the smaller size cohorts. For deals valued between $10 million–$25 million that did not conduct a sell-side QoE, 63% were add-ons. Of those that did conduct a sell-side QoE, only 50% were add-on transactions. At GF Data, we’ve written extensively about the competitive market conditions over the last two years that have driven up pricing for add-ons—in some cases, to levels higher than for platforms—and this distortion is likely impacting the results on the very smallest deals. The high multiples commanded by add-ons seem to trump the pricing benefits that come with a sell-side QoE.
Moving up market, the value of conducting a sell-side QoE becomes more pronounced, particularly with companies valued between $100 million–$250 million, where those that used a sell-side QoE recorded an average valuation nearly a full turn above those that did not.
Deals Dragging On
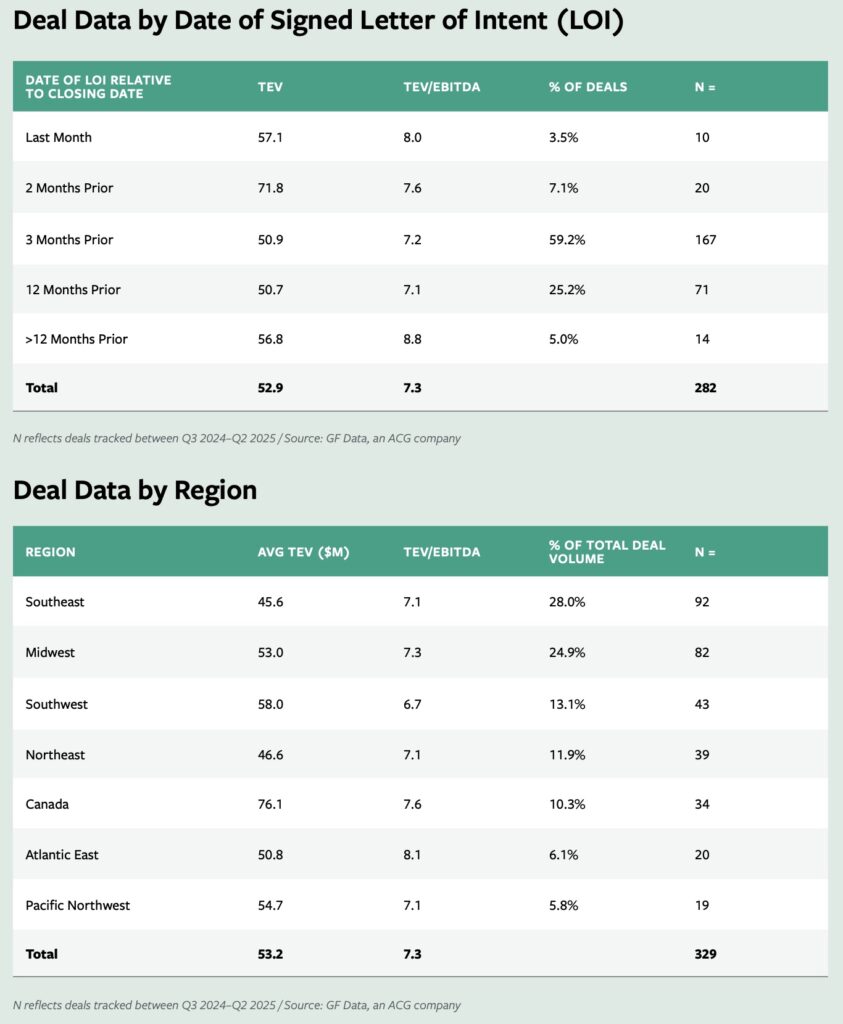
While most deals tracked between Q3 2024 and Q2 2025 closed within three months of signing a letter of intent, a large percentage of deals took 12 months or longer after the LOI to close.
A three-month closing window proved dominant over the period, with nearly 60% of deals falling into this category. Taken with deals that closed a month or two after an LOI, the total comes to nearly 70%. However, the remaining deals tracked indicate that deal closing occurred 12 months or more after an LOI was signed. While we lack historical data from timeframes before this period, the relatively high percentage of deals that closed after 12 months or more tracks with the market sentiment that due diligence processes are taking longer and that buyers and sellers are taking more time to negotiate deal pricing and key deal terms. It also likely speaks to the overall quality of companies that transacted over this period.
While these companies had the same average EBITDA margin as those that closed more quickly (21%), deals that took 12 months or longer to close had average TTM revenue growth of 12.9%, compared to 16.2% for deals that closed in three months or less.
Regional Character
In terms of regional activity tracked over the four-quarter period, the Southeast and Midwest recorded the highest tallies, with nearly 53% of total deal volume. Meanwhile, the Atlantic East region and Pacific Northwest garnered the lowest share of deal volume (6.1% and 5.8%, respectively).
Companies based in the Atlantic East had the highest valuations of the regions tracked, with an average trailing 12-month TEV/EBITDA multiple of 8.1%. At the other end, companies in the Southwest averaged just 6.7%.
Bob Dunn is Managing Director, GF Data.
Middle Market Growth is produced by the Association for Corporate Growth. To learn more about the organization and how to become a member, visit www.acg.org.