Building Business Intelligence from the Ground Up for Emerging Healthcare Roll-ups

Healthcare clinic roll-ups have struggled in recent years. Clinic valuations remain stubbornly high, and excessive interest rates and limited access to debt are dampening returns on existing platforms and deterring new ones from forming.
Mature platforms are taking value creation seriously, centering on key performance indicator (KPI) dashboards built on real-time data, maintained by computer scientists (referred to as “Business Intelligence” or BI). These dashboards become the centerpiece of other value creation initiatives (sales, marketing, operational, HR, etc.), allowing performance measurement down to the clinic level and up to the consolidated entity, on controllable KPIs like “new patients” and “average call answer speed.”
This section of the report is sponsored by Sapling Financial Consultants Inc. and originally appeared in the Fall 2025 issue of Middle Market Growth.
How can smaller and newer roll-ups compete? Setting up a BI system is relatively straightforward, even if overseen by business professionals. The key is breaking the project into manageable steps with a clear vision for a modest, functional minimum viable product.
First, determine which systems contain valuable reporting data. In the case of EMR/PMS software, clinics within the same specialty often join platforms with different systems in place. There’s no clear winner between unifying systems and keeping the current one. Besides the EMR/PMS, there is likely valuable data in HR systems, call software, CRMs, accounting software, and more. The key here is to start with the KPIs that drive value, then choose the fewest systems to achieve them. We like
to focus on just the EMR/PMSs to start.
Next, data must flow into a data warehouse. For smaller/newer roll-ups, a straightforward database solution like SQL Server is often sufficient. Flowing the data is challenging, but new technologies are making it easier. While pricey, Sikka.ai can integrate different EMR/PMSs across disciplines. Other systems can (often) be integrated through low-code/no-code solutions like Azure Data Factory and AWS Glue.
This next step may be the most work. Even on the same EMR/PMS, two clinics may define KPIs like “new patients” differently—e.g., how long before a lapsed patient is treated as a new patient? Does a different social security number or insurance policy number indicate a new or existing patient? Standardizing data requires an organized and thoughtful approach, and thankfully for many finance professionals, is less technical and more business-oriented.
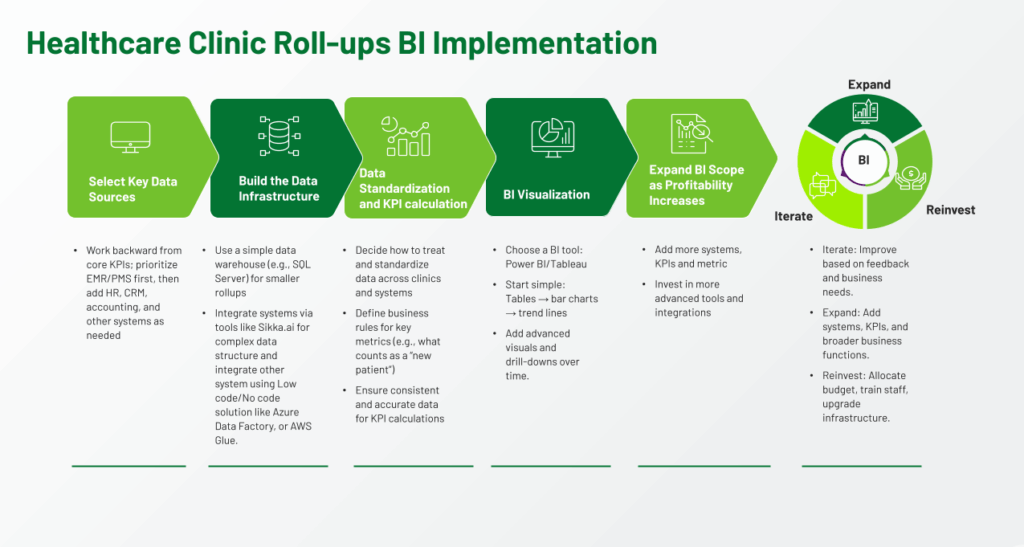
Once this is done, the fun begins. Setting up visualizations in Power BI or Tableau is an iterative process. The best practitioners will start simple—with, say, a table—and gradually rework the material (e.g., into a trending bar chart with percentage changes represented with a line chart and color) as they grow more familiar with the business and the data that represents it.
The key to a successful BI implementation is to start small—a few systems, a few metrics. The beauty of BI lies in its ability to expand ad infinitum as your successful roll-up increases profitability through BI, allowing for more reinvestment.
Rob Hong is CFA MFin, Co-Founder & CEO, Sapling Financial Consultants Inc.
Middle Market Growth is produced by the Association for Corporate Growth. To learn more about the organization and how to become a member, visit www.acg.org.