Global M&A by the Numbers: Insights from S&P Global Market Intelligence
S&P Global Market Intelligence breaks down the data on M&A activity in 2024
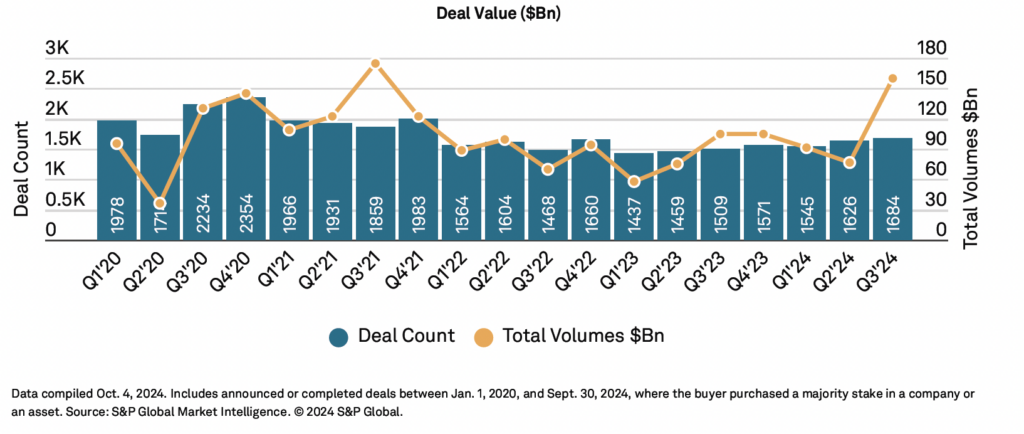
Global M&A activity saw positive signs in Q3 2024 as inflation continued to decline, credit conditions improved with central bank rate cuts and equity markets posted strong year-to-date returns.
Deal Counts held steady at 9,141 (+6% over Q3’23), in line with the median number of deals per quarter over the last six quarters at 9,114.
Total transaction values rose quarter-over-quarter (+9%) and year-over-year (+23%_, aided by eight megadeals (>$10B).
This section of the report is sponsored by S&P Global Market Intelligence and originally appeared in the Middle Market Growth 2025 Outlook Report.
Corporate divestitures also reached their highest quarterly transaction total ($162B) since Q3’21.
Global M&A Activity

Corporates Finding Value in Divestitures
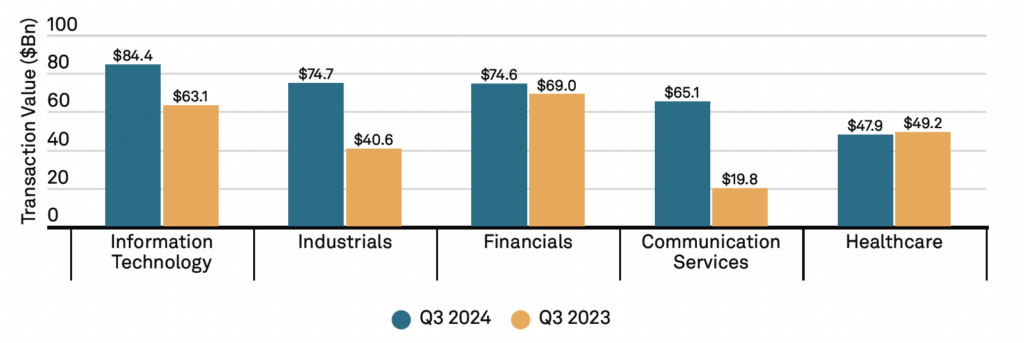
Sectors with the Most Q3 M&A Activity, 2024 vs. 2023
Information Technology saw the most deals in Q3 at $84B, with notable deals including the Airtrunk and Smartsheet acquisitions. The biggest jump was in Communication Services ($65B), which experienced the highest deal volumes since Q2’22, driven largely by the DISH sale and Verizon’s acquisition of Frontier Communications for $19B.
Other top sectors, Industrials ($77B) and Financials ($74B), also experienced year-over-year growth at 89% and 8%, respectively.
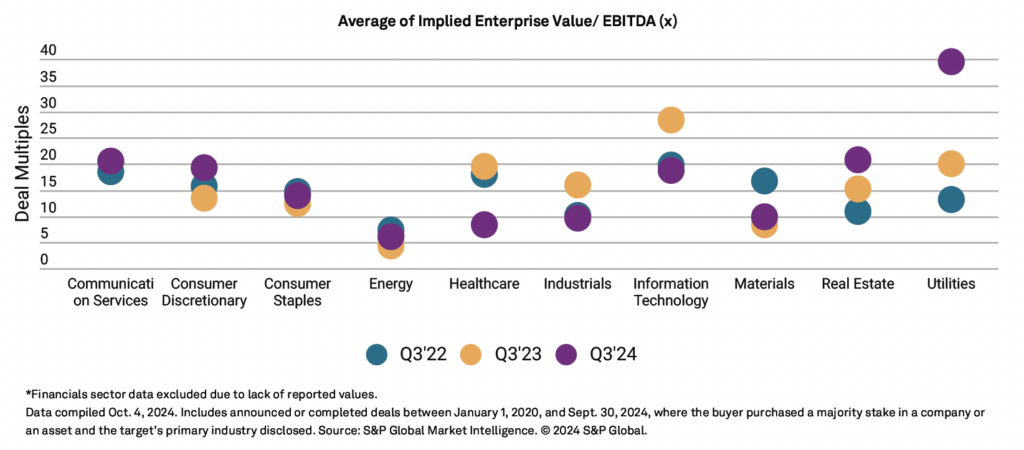
Average of Implied Enterprise Value/EBITDA (x) by Sector
Middle Market Growth is produced by the Association for Corporate Growth. To learn more about the organization and how to become a member, visit www.acg.org.